


Abstract
This article develops the Turkic States Sustainable Finance Index (TS-SFI), a region-specific composite framework for benchmarking sustainable finance readiness across the five members of the Organization of Turkic States (OTS): Azerbaijan, Kazakhstan, Kyrgyzstan, Türkiye, and Uzbekistan. Global indices seldom capture, within a single architecture, the joint constraints that shape these economies: post-Soviet institutional transition, hydrocarbon dependence, energy-transition pressure, Islamic finance potential, and external financial vulnerability. TS-SFI is organised into five dimensions: green finance capacity, institutional and regulatory framework, Islamic finance potential, energy-transition readiness, and external finance dependency and macro-financial buffers. To avoid rewarding economic size, all market-size indicators enter as ratios to GDP, and governance is measured with four Worldwide Governance Indicators. Indicators are min–max normalised and aggregated with equal weights, and the index is read as a five-dimensional readiness profile rather than a league table. Türkiye leads the composite in all main specifications, anchored in participation-finance depth and transition readiness, while Uzbekistan—whose labelled issuance relative to GDP is the deepest in the sample—is the robust runner-up; the remaining members cluster closely and their ordering is sensitive to measurement choices. TS-SFI is proposed as a diagnostic and coordination tool supporting the Turkic Green Vision.
Öz
Türk Devletleri Sürdürülebilir Finans Endeksinin (TS-SFI) Tasarımı: Bir Ölçüm Çerçevesi
Bu makale, Türk Devletleri Örgütü (TDT) üyesi Azerbaycan, Kazakistan, Kırgızistan, Türkiye ve Özbekistan’da sürdürülebilir finansa hazırlığın ülke düzeyinde karşılaştırılmasına yönelik bölgeye özgü bir bileşik endeks olan Türk Devletleri Sürdürülebilir Finans Endeksi’ni (TS-SFI) geliştirmektedir. Küresel endeksler, bu ekonomileri eşanlı biçimde şekillendiren Sovyet sonrası kurumsal dönüşüm, hidrokarbon bağımlılığı, enerji geçiş baskısı, İslami finans potansiyeli ve dış finansal kırılganlık gibi bileşik kısıtları tek bir ölçüm mimarisinde nadiren bütünleştirmektedir. TS-SFI beş boyutta kurgulanmıştır: yeşil finans kapasitesi, kurumsal ve düzenleyici çerçeve, İslami finans potansiyeli, enerji geçişine hazırlık ile dış finansman bağımlılığı ve makro-finansal tamponlar. Ekonomik büyüklüğün ödüllendirilmesini önlemek için tüm piyasa büyüklüğü göstergeleri GSYH’ye oran olarak tanımlanmakta, yönetişim ise dört Dünya Yönetişim Göstergesi ile ölçülmektedir. Göstergeler min–maks ölçekleme ile normalleştirilmekte ve eşit ağırlıklarla birleştirilmekte; endeks tek bir sıralama tablosu değil, beş boyutlu bir hazırlık profili olarak okunmaktadır. Türkiye, katılım finansı derinliği ve enerji geçişine hazırlığa dayalı olarak tüm ana spesifikasyonlarda bileşik endekste önde yer alırken, GSYH’ye oranla etiketli tahvil ihracında örneklemin en derin piyasasına sahip olan Özbekistan istikrarlı biçimde ikinci sıradadır; diğer üyeler birbirine yakın kümelenmekte ve sıralamaları ölçüm seçimlerine duyarlı olmaktadır. TS-SFI, Türk Yeşil Vizyonu’nu destekleyen bir teşhis ve koordinasyon aracı olarak önerilmektedir.
Article Text
Introduction
Sustainable finance has moved to the core of global economic governance as regulators and market actors seek to redirect capital toward low-carbon transitions. In operational terms, sustainable finance denotes financial activities that integrate environmental, social, and governance (ESG) considerations into investment and lending decisions (Thompson 20). It is also framed as a new paradigm in which value creation and risk management must account for externalities and long-horizon sustainability risks that standard metrics underweight (Fatemi and Fooladi 106). Within the 2030 Agenda, it is positioned as a mechanism for mobilising public and private capital toward sustainable development objectives (Miralles-Quirós and Miralles-Quirós 2). As sustainable finance becomes embedded in supervisory and market practice, a central policy question emerges: how to measure its depth and effectiveness in a way that is comparable across countries and actionable for reform (Lofts and Meekings 3).
This measurement challenge is especially salient for the Turkic States and the broader Central Asian subregion. Regional assessments emphasise that Central Asian economies contribute little to global emissions yet face disproportionate climate impacts, including glacier retreat and risks to water security and agriculture (Astana International Financial Centre, State of Sustainable Finance 8, 10). Meanwhile, transition pathways are constrained by fossil-fuel dependence and macroeconomic vulnerabilities. For Kazakhstan, UNCTAD highlights an energy-export-driven model whose reliance on fossil fuels complicates the shift toward alternatives (Abazov et al. 27–28). For Uzbekistan, the OECD stresses that financing the green transition requires capital-market development and credible pathways for green bond issuance (OECD 11–14). Market-building remains uneven: UNDP’s Kyrgyzstan assessment finds green finance weakly institutionalised, with limited metrics and standards and an early-stage market (UNDP 7, 10).
Existing indices offer useful benchmarks, but they operationalise sustainable finance through different regional scopes and policy lenses. Such designs do not, by construction, capture features that matter here: the interaction between green finance capacity and energy-transition constraints (Abazov et al. 27–28; Astana International Financial Centre, State of Sustainable Finance 8), institutional gaps and data limitations in nascent markets (UNDP 7), and finance structures beyond conventional ESG channels. Islamic finance, in particular, is frequently discussed as conceptually aligned with sustainability objectives (Sunarya and Rusydiana 1, 4), and sustainable banking frameworks emphasise embedding ESG criteria into institutions’ investment decisions (Muyinza 5, 7). Evidence on green and social finance further suggests that macro-financial conditions shape the space within which sustainability policies operate (Nawaz et al. 1). Section 2.6 positions TS-SFI against the main existing frameworks in a structured comparison, and Section 3.1 sets out the structural features of the Turkic States that motivate a dedicated regional design.
To address these gaps, this paper proposes the Turkic States Sustainable Finance Index (TS-SFI), a region-specific composite designed to benchmark (i) green finance capacity, (ii) institutional and policy frameworks, (iii) Islamic finance potential, (iv) energy-transition readiness, and (v) external macro-financial constraints for the five OTS member states. Two design commitments follow. First, TS-SFI measures the readiness and enabling environment for sustainable finance, not realised sustainability performance. Second, all market-size indicators enter as ratios to GDP rather than as absolute volumes, so that the index measures development relative to economic size rather than rewarding scale. The index is deliberately framed as a transparent diagnostic profile rather than a definitive ranking: in a five-country setting only the leading pair—Türkiye and Uzbekistan—and the dominant role of market depth prove stable, while the ordering of the remaining members is sensitive to reasonable changes in measurement. Read in this way, TS-SFI provides a structured basis for evidence-based prioritisation and cross-country learning across the region.
Literature Review
Sustainable Finance and the Policy Rationale
Sustainable finance is widely framed as the incorporation of environmental, social, and governance considerations into financial decision making, with the aim of shifting capital allocation and risk management toward long-term value creation (Fatemi and Fooladi 101); this places it at the level of financial-system functioning rather than a narrow product category. The 2030 Agenda literature likewise positions it as a financing channel for structural transformation aligned with the SDGs (Miralles-Quirós and Miralles-Quirós 1).
The policy rationale is not uniform. One line stresses its governance function as an institutional mechanism that hardens commitments to climate action under political constraints (Fuest and Meier 1); another emphasises the political economy of policymaking, in which multi-stakeholder and elite networks shape agendas (Tischer and Ferrando 113). This matters for index design, because measured “engagement” can reflect both genuine transition effort and signalling incentives, depending on institutional context and enforcement capacity.
Index-Based Approaches and Composite Measurement
Because sustainable finance is multi-dimensional, composite indices have become a common strategy to compare countries, markets, or institutions. The Climate-related Financial Policy Index, for example, aggregates policy components to benchmark engagement in green financial policymaking across countries (D’Orazio and Thole 1), and work on responsible investment indices shows that indices can act as governance tools, standard setters, and market signals rather than only measurement devices (Lydenberg and White 527–528).
Practice-oriented products combine similarly heterogeneous inputs: the EY Sustainable Finance Index packages cross-country indicators into a single benchmark (Lofts and Meekings 3–4), while the Sustainable Finance Index for Latin America and the Caribbean applies related logic for civil-society monitoring (GFLAC 3). The implication is that index outputs depend heavily on indicator selection, scaling, and weighting, so validity must rest on conceptual grounds and explicit sensitivity analysis.
Comparability is a recurring concern: evidence from the Dow Jones Sustainability Indices shows that index-based differences vary across settings (Schmutz et al. 1), and sustainability-index signals can diverge from ESG scores, implying related but non-identical constructs (Tehrani et al. 2). For a Turkic States index, transparency about construction rules and robustness is therefore part of methodological credibility.
Evidence on Channels and Outcomes
A large empirical literature links sustainable finance to measurable outcomes: together with green technologies and environmental policies, it is associated with lower environmental degradation (Iqbal et al. 1), and studies on emerging economies link its development to improved energy efficiency through innovation, industrial upgrading, or resource-allocation channels (Liu et al. 1; Wang and Xu 1). Many studies build their own indices as part of causal analysis, which reinforces the importance of construction choices in shaping substantive inference (Gao et al. 1; Jiang et al. 1). Firm- and sector-level work further indicates that ESG-linked outcomes can depend on moderating factors and measurement choices (Cantero-Saiz et al. 1; Rumansyah and Nainggolan 1894). These findings motivate treating TS-SFI as a benchmarking framework for readiness and capacity rather than as a direct impact measure.
Central Asia and the Turkic States Context
Regional work on Central Asia emphasises that transition constraints are institutional and structural, not only technological. For Kazakhstan, green transformation is discussed as a strategic agenda that requires implementation capacity and coordination, not just target setting (Abazov et al. 3). Kazakhstan’s green finance ecosystem is likewise tied to market infrastructure, instrument availability, and the enabling environment for issuers and investors (Astana International Financial Centre, Green Finance Market 3, 5). A broader overview points to climate-vulnerability pressures and the value of regional progress tracking (Astana International Financial Centre, State of Sustainable Finance 2, 8, 10).
Country diagnostics echo these themes: UNDP characterises the Kyrgyz green finance market as early-stage, with gaps in standards and indicators (UNDP 2, 7), and the OECD links Uzbekistan’s green-transition financing to capital-market development and thematic instruments, including green sukuk (OECD 9–10). These sources jointly suggest that a Turkic States index should be sensitive to market-formation conditions, institutional readiness, and transition exposure, rather than relying on generic global templates.
Islamic Sustainable Finance and Institutional Implementation
A related strand treats Islamic finance as a potential channel for sustainability-oriented finance, while also stressing governance and standardisation issues. A qualitative review stresses conceptual compatibility with sustainability objectives alongside institutional-design and disclosure constraints (Sunarya and Rusydiana 197). Studies of Indonesian Islamic banking show how such frameworks are operationalised through reporting requirements, governance mechanisms, and bank-level implementation differences (Qudriyah et al. 544; Ani and Fredy 437), and practitioner-oriented work treats ESG integration as an embedded decision rule for financial institutions rather than an add-on product line (Muyinza 5). This literature supports treating Islamic finance as enabling capacity for mobilisation, while cautioning that its scale is not, in itself, evidence of realised sustainability performance.
Research Gap and Positioning against Existing Indices
Two gaps stand out across these literatures. First, while composite indices exist for policy engagement and sustainable finance benchmarking, region-specific index designs tailored to the institutional realities and transition constraints of the Turkic States remain limited. Second, many index approaches treat transition vulnerability and financial-system capacity as separate domains, even though the Central Asia evidence indicates that climate exposure, institutional capacity, and market development interact in shaping feasible transition pathways (Astana International Financial Centre, State of Sustainable Finance 2, 8, 10; UNDP 2, 7; OECD 9–10).
Appendix 3 (Table A7) positions TS-SFI against the main existing frameworks along four dimensions—geographical scope, dimensional focus, indicator basis, and intended use. Three differences stand out. First, existing country-level indices are either global in scope or tailored to other regions, so their indicator sets are not designed around the joint constraints of the Turkic States; firm-level index families measure corporate sustainability rather than country readiness. Second, TS-SFI is, to the authors’ knowledge, the only framework that places Islamic finance potential inside a sustainable finance index architecture, which matters in a region where participation finance is an available mobilisation channel. Third, TS-SFI is explicitly designed as a readiness and coordination instrument for a specific policy community—the OTS and the Turkic Green Vision—rather than as an investment screen or a global advocacy benchmark. TS-SFI therefore addresses these gaps with a measurement framework aligned with policy engagement, scale-adjusted market depth, and transition relevance in the regional context, while making the sensitivity of the resulting profile explicit.
Conceptual Framework of the TS-SFI
TS-SFI is a cross-country composite that captures how Turkic States are positioning their financial systems and enabling institutions for a credible green transition. The core motivation is practical comparability: policymakers, regulators, and market actors need a consistent way to track readiness and financing capacity against the SDG-related transition agenda (Fatemi and Fooladi 101; Miralles-Quirós and Miralles-Quirós 4). The framework therefore combines market-facing capacity with institutional conditions that shape credibility and implementation. TS-SFI measures the readiness and enabling environment for sustainable finance—market depth relative to economic size, governance quality, latent mobilisation channels, transition context, and macro-financial space—not the realised environmental or social performance of financial flows.
A second motivation is interpretability: indices work as translation devices that convert a complex domain into comparable signals, provided scope choices are transparent and concept and indicators are defensibly linked (Lydenberg and White 527–528). TS-SFI accordingly uses five dimensions that reflect recurring building blocks in the literature and in index practice: green finance capacity, institutional and regulatory framework, Islamic finance potential, energy-transition readiness, and external finance dependency and macro-financial buffers (GFLAC 3; Lofts and Meekings 4). The dimensions are intended to be read jointly, since transition performance depends on how market instruments, institutional capacity, and macro conditions interact (D’Orazio and Thole 1; Fuest and Meier 1). Because the dimensions capture conceptually distinct constraints, the index is presented as a profile across pillars rather than as a single score.
Why the Turkic States Require a Dedicated Framework
A regional index is justified only if the region shares structural features that global templates do not capture jointly. Five such features shape both the case for TS-SFI and its indicator selection.
First, post-Soviet institutional transition. Four of the five OTS members are post-Soviet economies whose regulatory institutions, supervisory practice, and market infrastructure are still converging toward international standards, and regional assessments consistently identify implementation capacity—not target setting—as the binding constraint on green transformation (Abazov et al. 3; Filipović et al. 1). This is why TS-SFI includes a dedicated institutional dimension (D2) built from governance indicators that capture enforcement capacity rather than from formal policy adoption, which is nearly universal in the sample.
Second, hydrocarbon dependence combined with renewable potential. Azerbaijan and Kazakhstan are hydrocarbon exporters, Uzbekistan remains gas-dependent, and Türkiye is an energy importer with a large renewables programme, while Kyrgyzstan already has a hydropower-dominated electricity mix; energy-export dependence complicates Kazakhstan’s shift toward alternatives (Abazov et al. 27–28). This heterogeneity creates very different transition-financing needs and motivates measuring energy-transition context (D4) alongside financial-system variables.
Third, external dependence and macro-financial fragility. Four of the five members are landlocked, and the subregion combines high climate vulnerability with dependence on external financing and commodity revenues (Astana International Financial Centre, State of Sustainable Finance 8, 10), so transition programmes compete for scarce fiscal and external space (Onyimadu and Uche 1). Dimension 5 accordingly measures the macro-financial buffers that condition how fast sustainable finance can scale without external distress.
Fourth, nascent, bank-dominated capital markets. Labelled sustainable finance markets in the region are thin, lumpy, and unevenly documented (OECD 11–14; UNDP 7, 10; Astana International Financial Centre, Green Finance Market 3). Dimension 1 therefore measures market depth as cumulative labelled issuance over a multi-year window, expressed relative to GDP, with an explicit protocol separating true zeros from missing data.
Fifth, Islamic finance affinity and an emerging coordination agenda. All five members have predominantly Muslim populations, and Islamic finance is discussed as a conceptually aligned mobilisation channel for sustainability objectives (Sunarya and Rusydiana 197). The OTS has also adopted a shared political framework for green cooperation: the Turkic Green Vision declaration commits members to cooperation on sustainable development and on financing and investment for the green transition (Organization of Turkic States 3). TS-SFI includes Islamic finance potential (D3) as a region-relevant channel and is designed to serve as the monitoring instrument that this coordination agenda currently lacks.
Global indices capture none of these features jointly: they either exclude Islamic finance, ignore transition context, measure firms rather than countries, or serve other regions’ policy communities (Appendix 3, Table A7). Each structural feature above maps onto one element of the TS-SFI architecture, which is developed dimension by dimension below.
Dimension 1: Green Finance Capacity
This dimension captures observable market depth and supporting infrastructure for green and sustainable financial activity—the financial system’s ability to mobilise capital into transition-related projects, not environmental outcomes. Reported issuance and institutional market-building platforms are treated as signals of market formation (Astana International Financial Centre, Green Finance Market 3), consistent with the view that sustainable finance becomes operational when instruments, standards, and institutions allow capital to be intermediated at scale (Thompson 3). Because labelled issuance in the region is thin and lumpy, market depth is measured as cumulative issuance over a multi-year window, which reduces the influence of one-off transactions and single-year gaps. The labelled aggregate covers green, social, sustainability, and sustainability-linked (GSSS) instruments—the full labelled universe reported by the IMF Climate Change Indicators Dashboard—so the socially oriented segment is captured alongside the environmental one. Cumulative issuance is expressed as a percentage of GDP rather than in absolute dollars, for the scale-adjustment reasons set out in Section 4.4.
Dimension 2: Institutional and Regulatory Framework
This dimension reflects general institutional quality and regulatory capacity, which condition the credibility and enforceability of sustainable finance commitments. Composite measures of climate-related financial policymaking show that engagement differs materially across countries and can be measured in a structured way (D’Orazio and Thole 1); sustainable finance policies can also act as commitment devices that lock in transition direction (Fuest and Meier 1). In Central Asia, calls for clearer regulatory frameworks are explicitly linked to scaling sustainable finance markets (Astana International Financial Centre, State of Sustainable Finance 2, 8).
The dimension is built from four Worldwide Governance Indicators on a common 0–100 scale: rule of law, regulatory quality, control of corruption, and voice and accountability. The first two capture contract enforceability and the quality of market regulation; control of corruption underpins the integrity of project selection and use-of-proceeds verification; voice and accountability captures the societal demand channels that discipline sustainability commitments. Together they give the governance pillar of the ESG triad an explicit, multi-indicator representation. All five members have adopted a national green or sustainable finance strategy; because this commitment is universal it does not differentiate members and is recorded as context rather than as an index input.
Dimension 3: Islamic Finance Potential
This dimension measures the structural capacity of Islamic finance to contribute to sustainable finance goals, particularly through risk-sharing instruments and social finance channels; Islamic finance is often framed as compatible with sustainability objectives through welfare-oriented principles and instruments such as sukuk and waqf-linked approaches (Sunarya and Rusydiana 197–198). The dimension is explicitly framed as enabling capacity, not realised sustainability performance. A large Islamic banking sector can be entirely conventional in its lending; scale therefore proxies the channel that could be mobilised, not what currently flows through it. The bridge from potential to performance runs through sustainability-labelled Islamic instruments, above all green sukuk; as labelled instruments these are captured under Dimension 1 when issued and are not double-counted here. Market-size indicators in this dimension (Islamic banking assets and sukuk outstanding) are, like Dimension 1, expressed relative to GDP so that they measure penetration rather than absolute scale.
The Muslim population share is retained as a latent-demand proxy: it indicates the demographic base within which Sharia-compliant instruments can mobilise savings that conventional instruments may not reach. Its raw discriminatory power in this sample is limited: four members have shares above 0.9 and only Kazakhstan (0.78) sits visibly lower. It is nevertheless the only Dimension 3 indicator that assigns a positive latent-capacity score to members with no operating Islamic finance market, and its influence is tested directly: a robustness variant that removes it leaves the leading pair unchanged and reshuffles only the middle cluster (Appendix 2, Table A6). Dimension 3 thus captures whether the institutional and demographic foundations exist for Islamic finance to complement conventional channels, especially where green finance markets remain shallow (OECD 9–10).
Dimension 4: Energy Transition Readiness
This dimension captures the structural conditions that shape the feasibility and urgency of the transition. In Central Asia, transition prospects are commonly discussed in relation to energy structure, investment needs, and the post-2022 outlook (Filipović et al. 1), and readiness reflects resource dependence, policy constraints, and implementation gaps (Abazov et al. 4, 9).
The rationale for placing these real-economy indicators inside a sustainable finance index is demand-side: the energy mix, carbon intensity, and decarbonisation commitments jointly determine the scale and composition of the investable transition pipeline that sustainable finance is supposed to fund, and the net-zero strategy dummy signals the policy direction against which investors price transition projects (OECD 9; Astana International Financial Centre, State of Sustainable Finance 8). Favourable energy endowments without market development indicate latent, unmet financing opportunity. Treating energy readiness as a separate pillar keeps this distinction visible: Kyrgyzstan can score highly on D4 through a hydropower-dominated mix while recording no labelled market activity, and the profile reading prevents the composite from disguising that contrast. For readers who prefer a strictly financial-system index, Appendix 2 reports the composite with Dimension 4 excluded (Table A3); the leading position is unchanged. As comparable data mature, this dimension can be reoriented from energy outcomes toward finance-side transition indicators (Section 7.4).
Dimension 5: External Finance Dependency and Macro-Financial Buffers
This dimension captures whether a country has the macro-financial resilience to fund transition needs without destabilising external balances. The theoretical link to sustainable finance runs through fiscal and external space: transition programmes are capital-intensive and front-loaded, and in developing economies they compete with debt service and external financing constraints (Onyimadu and Uche 1). Countries with weak buffers face a higher cost of transition capital, depend more on concessional finance, and are more exposed to shocks that crowd out sustainability spending; assessments accordingly tie green-transition financing to capital-market instruments and credible issuance pathways (OECD 9). Incorporating macro-financial conditions into sustainable finance measurement has precedent in index practice for developing regions (GFLAC 3).
The dimension is built from three ratio-based buffers: external debt (relative to GNI, inverted), the current-account position (relative to GDP), and reserve adequacy measured in months of imports. It deliberately excludes the level of GDP, which would mechanically reward larger economies independently of their transition-financing capacity. A more targeted “climate finance vulnerability” refinement is identified as a future extension (Section 7.4).
These five dimensions determine the indicator selection and mapping reported in Appendix 1 (Table A1); each indicator is assigned to a single dimension to avoid double counting. Section 4 specifies the normalisation, weighting, and robustness steps used to compute the composite.
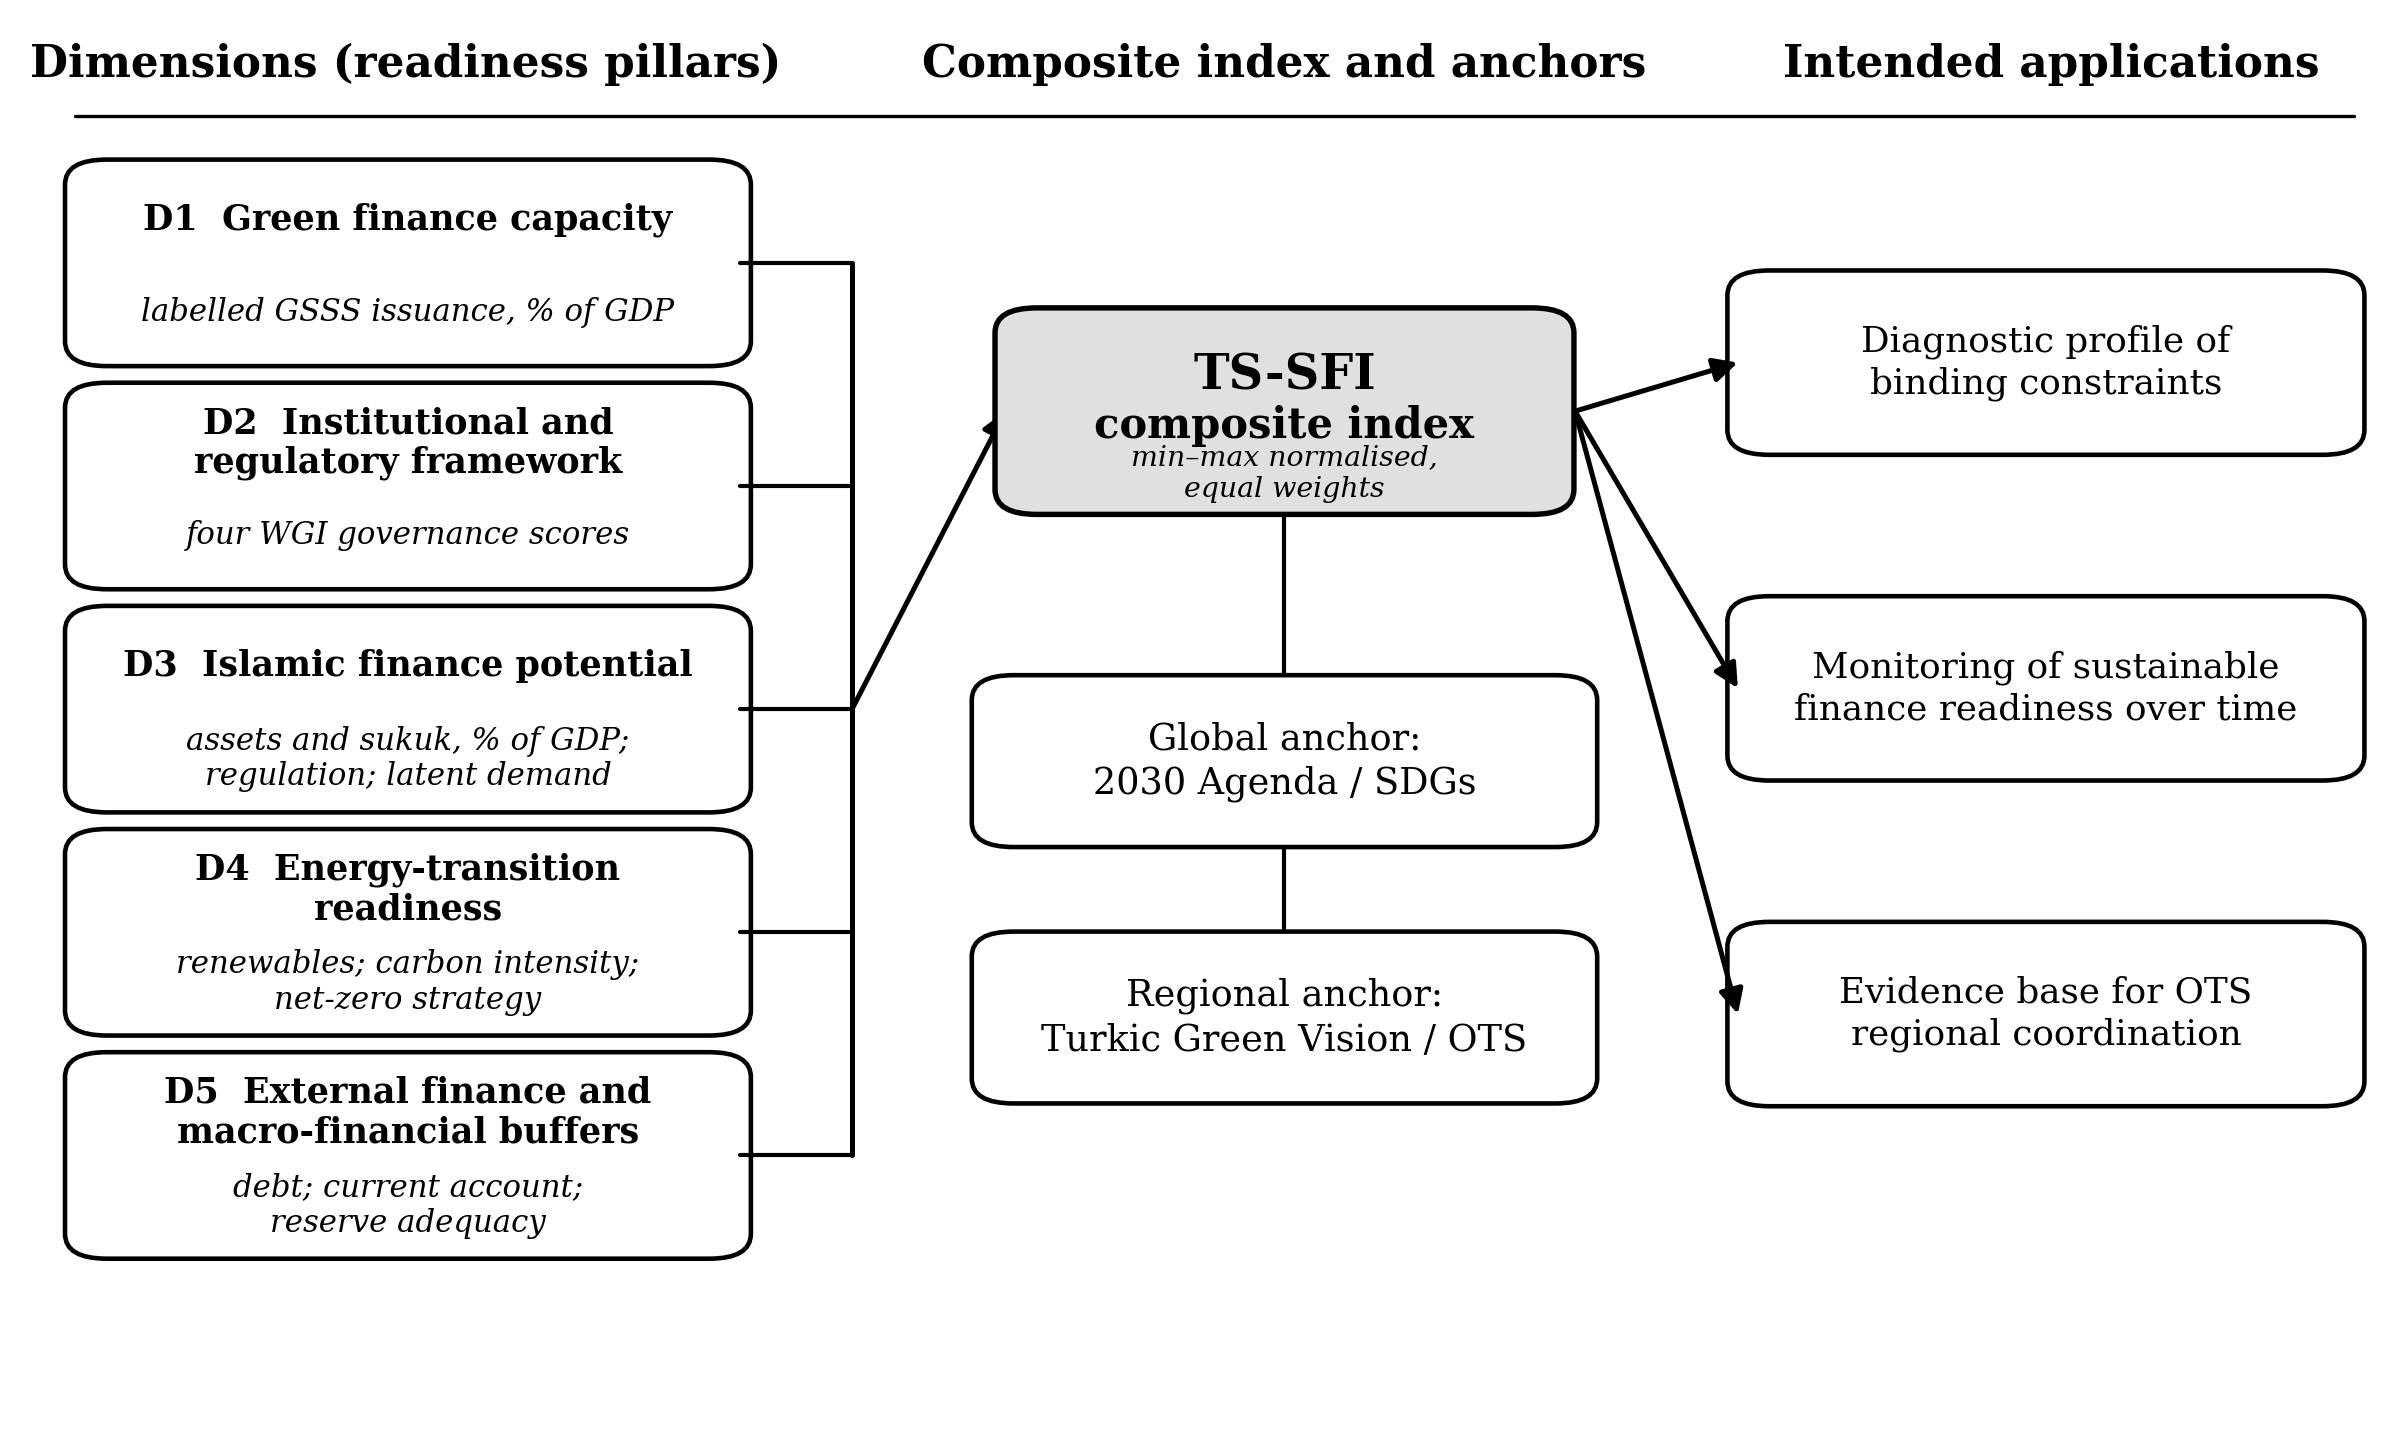
Figure 1. Conceptual structure of the TS-SFI (Source: Author’s illustration).
Data and Methodology
This section explains how TS-SFI is constructed for the five OTS member states. The design follows established composite-index practice in sustainable finance and climate-related financial policymaking, while adapting indicators to the data environment of the Turkic region (D’Orazio and Thole 1; GFLAC 3).
Scope, Coverage, and Reference Period
TS-SFI is a cross-sectional, country-level index computed for the five OTS member states, consistent with sustainable finance indices that monitor conditions at specific points in time (GFLAC 3). Structural and macro-financial conditions are measured for 2022, the most recent year with broad cross-country coverage across the indicator set. Green finance market depth (Dimension 1) is the exception: because labelled issuance is thin and dominated by individual transactions, it is measured as cumulative issuance over 2022–2024, which treats market depth as a stock-like quantity and avoids single-year distortion. Ratio denominators match the indicator’s reference period: 2022 indicators are scaled by 2022 GDP, and the cumulative 2022–2024 issuance stock by 2023 GDP, the midpoint of the window. Where a 2022 observation is unavailable, the closest available year is used and documented in Appendix 1 (Table A1).
Data Sources and Indicator Mapping
TS-SFI combines three data layers. First, international statistical sources provide comparable indicators across all five countries: the World Bank’s World Development Indicators and Worldwide Governance Indicators, the IMF Climate Change Indicators Dashboard, the International Energy Agency, Our World in Data, the Pew Research Center, the Islamic Financial Services Board, the Participation Banks Association of Türkiye (TKBB), the Islamic Corporation for the Development of the Private Sector with LSEG, and the Net Zero Tracker. Second, regional and country diagnostics validate and complete sustainable finance market variables where global coverage is incomplete, especially for labelled thematic bond volumes (Astana International Financial Centre, State of Sustainable Finance 3; OECD 11; UNDP 25) and, for Kazakhstan’s bank-level Islamic banking assets, the Forbes Kazakhstan bank-ranking profiles (Forbes Kazakhstan, «ADCB»; Forbes Kazakhstan, “Islamic Bank”). Third, methodological references justify the standardisation and aggregation choices (D’Orazio and Thole 1; Jiang et al. 1, 5). The complete indicator list, definitions, sources, years, and data exceptions are reported in Appendix 1 (Table A1).
TS-SFI Dimensions and Indicators
The index contains five dimensions and sixteen indicators.
Dimension 1 — Green finance capacity is proxied by cumulative labelled green, social, sustainability, and sustainability-linked (GSSS) bond issuance over 2022–2024, expressed as a percentage of 2023 GDP (International Monetary Fund; World Bank, World Development Indicators), cross-checked against regional and country sources (Astana International Financial Centre, Green Finance Market 3; OECD 11; UNDP 25).
Dimension 2 — Institutional and regulatory framework combines four Worldwide Governance Indicators on a common 0–100 scale: rule of law, regulatory quality, control of corruption, and voice and accountability (World Bank, Worldwide Governance Indicators). Using a single
Dimension 3 — Islamic finance potential combines Islamic banking assets (% of GDP), sukuk outstanding (% of GDP), the presence of a dedicated Islamic finance legal or regulatory framework, and demographic depth proxied by Muslim population share.
Dimension 4 — Energy-transition readiness combines the renewable share in energy consumption, renewable electricity generation per capita, the carbon intensity of GDP (inverted, since lower is better), and the presence of a long-term decarbonisation or net-zero strategy. The carbon-intensity series is taken from the World Bank’s harmonised measure (kg CO₂e per 2021 PPP$ of GDP) to ensure a single, consistent unit definition across all five countries.
Dimension 5 — External finance dependency and macro-financial buffers combines external debt stocks (% of GNI, inverted), the current-account balance (% of GDP), and total reserves expressed in months of imports. The level of GDP is excluded (Section 3.6).
Scale Adjustment: Ratios Rather than Absolute Volumes
A composite that mixes absolute monetary volumes with ratio indicators systematically favours larger economies: a US$1 trillion economy will issue more labelled bonds and hold more banking assets than a US$15 billion economy even if its sustainable finance system is no more developed relative to its size. To remove this size bias, every market-size indicator in TS-SFI enters as a ratio. Cumulative GSSS issuance is expressed as a percentage of GDP (D1.1); Islamic banking assets and sukuk outstanding are expressed as percentages of GDP (D3.1, D3.2); and reserve adequacy is expressed in months of imports rather than in dollar levels (D5.3). The remaining indicators are already shares, per-capita quantities, index scores, or dummies. Scale adjustment is consequential: as Section 5.4 shows, replacing ratios with absolute levels materially changes the ordering beneath the composite leader. Per-capita scaling is a defensible alternative; a per-capita variant is therefore reported in the robustness battery (Appendix 2, Table A5).
Normalisation
Following standard practice in composite indices, TS-SFI uses min–max normalisation to map indicators of different units and scales onto a common [0, 1] interval, interpreted as relative positions within the OTS group. For an indicator j where a higher raw value is desirable, the normalised score for country c is
where is the observed value and and are the minimum and maximum across the five OTS countries. For indicators where a higher raw value is undesirable (external debt ratio, carbon intensity), the transformation is inverted:
Dummy variables are used directly. Alternative strategies—z-score standardisation, distance-to-target rescaling, and multi-criteria methods such as GRA, TOPSIS, WASPAS, and MEREC-based WEDBA—typically begin from linear normalisation (Lofts and Meekings 4; Aytekin and Gündoğdu 16; Ateş and Usman 34; Altıntaş 2). Given the small sample, TS-SFI uses min–max as its baseline and reports z-score results among the robustness checks.
Weighting and Aggregation
Normalised indicators are combined into dimension scores and then into a single TS-SFI value. The literature offers equal weighting, entropy-based weights, hybrid expert–data schemes, multi-criteria methods, and optimisation-based weights. Given the very small sample and the need for transparency and replicability, TS-SFI adopts a simple two-step equal-weighting scheme: the normalised indicators within a dimension are averaged to obtain that dimension’s score,
and the five dimension scores are then averaged to obtain the composite,
Equal weighting is a transparency-oriented design choice, not an empirical claim that each pillar carries identical economic importance. Crucially, even under equal nominal weights, dimensions with greater cross-country dispersion contribute more to rank separation and to the variance of the composite—a property made explicit in Section 5 and quantified in Appendix 2.
The instability of data-driven weights in this setting is not asserted but demonstrated. The robustness battery includes two entropy-based variants (Table A6): Shannon-entropy weights computed at the dimension level assign 46 percent of the total weight to green finance capacity and only 4 percent to institutions, whereas the same method applied at the indicator level produces a markedly different composite—the two implementations disagree even on the identity of the leading country (Section 5.4). Principal-component weighting is not reported at all: with five observations and five dimensions, the estimated components would be statistical artefacts. These results are the empirical case for fixed, equal weights as the headline and data-driven weights as sensitivity information.
Missing Data, Recorded Zeros, and Indicator-Level Exceptions
Green and sustainable finance data remain incomplete for some OTS members, so TS-SFI applies a transparent treatment of missing values and recorded zeros. First, when an indicator is available only for a neighbouring year, the closest available year is used and documented in Appendix 1 (Lofts and Meekings 3; GFLAC 3). Second, measuring market depth as cumulative 2022–2024 issuance largely removes the missing-versus-zero ambiguity for Dimension 1: a country is assigned a true zero only when no labelled issuance is recorded in any year of the window and regional or national sources confirm the absence of a market; on this basis Azerbaijan and Kyrgyzstan are coded as true zeros. Third, if an indicator is genuinely unavailable and cannot be approximated, it is excluded from the relevant dimension for that country, and the dimension score is computed from the remaining indicators.
Robustness and Limitations
Because a five-country, min–max design is sensitive to indicator definitions and to extreme values, indicator units and scales were validated against their original sources prior to normalisation, and the index is accompanied by an extensive robustness battery rather than a single specification. Appendix 2 reports (i) a covariance-based decomposition of dimension dominance, (ii) alternative dimension weights, (iii) z-score standardisation, (iv) leave-one-dimension-out recomputation, (v) three design variants: an institutional dimension rebuilt from the V-Dem rule-of-law index, a levels variant that reinstates absolute dollar volumes for the market-size indicators, and a per-capita variant that scales market size by population instead of GDP, and (vi) two entropy-weighted variants together with an indicator-exclusion variant that removes the Muslim population share.
TS-SFI also has clear limitations. It covers five countries and a recent reference period, which precludes advanced statistical weighting or causal inference linking the index to outcomes such as emissions or growth. Green finance capacity is proxied by a single indicator—labelled GSSS issuance—because it is the only market-depth measure observable on a comparable basis for all five countries; unlabelled green credit, green funds, and taxonomy-aligned lending are not yet consistently reported, so Dimension 1 captures the labelled segment of the market and the composite inherits this narrowness. The social pillar of the ESG triad is represented only partially—through the social and sustainability components of GSSS issuance—because comparable social-finance indicators are not yet available for all five members; a dedicated social-finance dimension is a priority extension (Section 7.4). The Muslim population share has limited discriminatory power in this sample (Section 3.4), and some indicators, especially GSSS volumes and Islamic finance assets, may carry measurement error from differences in national taxonomies. Finally, TS-SFI is a readiness index; it does not assess the additionality of specific projects or identify causal effects.
Empirical Results and Discussion
Overall TS-SFI Scores
Table 1 reports the composite TS-SFI score and the five dimension scores for each member (min–max normalised), and Figure 2 visualises the profiles.
Table 1
TS-SFI and Dimension Scores (Min–Max Normalised, 0–1)
| Country | D1 | D2 | D3 | D4 | D5 | TS-SFI | Rank |
|---|---|---|---|---|---|---|---|
| Türkiye | 0.472 | 0.550 | 1.000 | 0.839 | 0.385 | 0.649 | 1 |
| Uzbekistan | 1.000 | 0.378 | 0.230 | 0.254 | 0.651 | 0.503 | 2 |
| Azerbaijan | 0.000 | 0.537 | 0.219 | 0.217 | 0.740 | 0.342 | 3 |
| Kazakhstan | 0.049 | 0.923 | 0.003 | 0.356 | 0.277 | 0.322 | 4 |
| Kyrgyzstan | 0.000 | 0.302 | 0.196 | 0.902 | 0.014 | 0.283 | 5 |
Source: Authors' calculations from the indicator matrix in Appendix 1 (Table A1). Note: scores are min–max normalised (0–1); market-size indicators enter as ratios (Section 4.4); for labelled GSSS issuance (D1) a value of 0 denotes a confirmed true zero, see Section 4.7. Robustness checks are in Appendix 2.
The central result is a robust leading pair. Türkiye records the highest composite value (0.649), anchored in Islamic finance potential (D3 = 1.000), energy-transition readiness (D4 = 0.839), and the region’s largest absolute labelled market (D1 = 0.472). Uzbekistan follows (0.503), and the scale adjustment is what makes its position visible: its cumulative 2022–2024 labelled issuance amounts to 3.7 percent of GDP—the deepest labelled market in the sample relative to economic size, against Türkiye’s 1.7 percent (D1 = 1.000)—and it holds the second-strongest external buffers (D5 = 0.651), anchored by reserves covering eleven months of imports. The remaining three members lie within a narrow band (0.283–0.342) and are best read as distinct profiles rather than as a precise ranking. Azerbaijan (0.342) pairs the strongest macro-financial buffers (D5 = 0.740) with no labelled issuance at all. Kazakhstan (0.322) has by far the strongest institutions (D2 = 0.923) but very thin scale-adjusted sustainable finance and Islamic finance markets (D1 = 0.049; D3 = 0.003). Kyrgyzstan (0.283) combines the strongest energy-transition readiness (D4 = 0.902) with the weakest macro-financial buffers (D5 = 0.014).
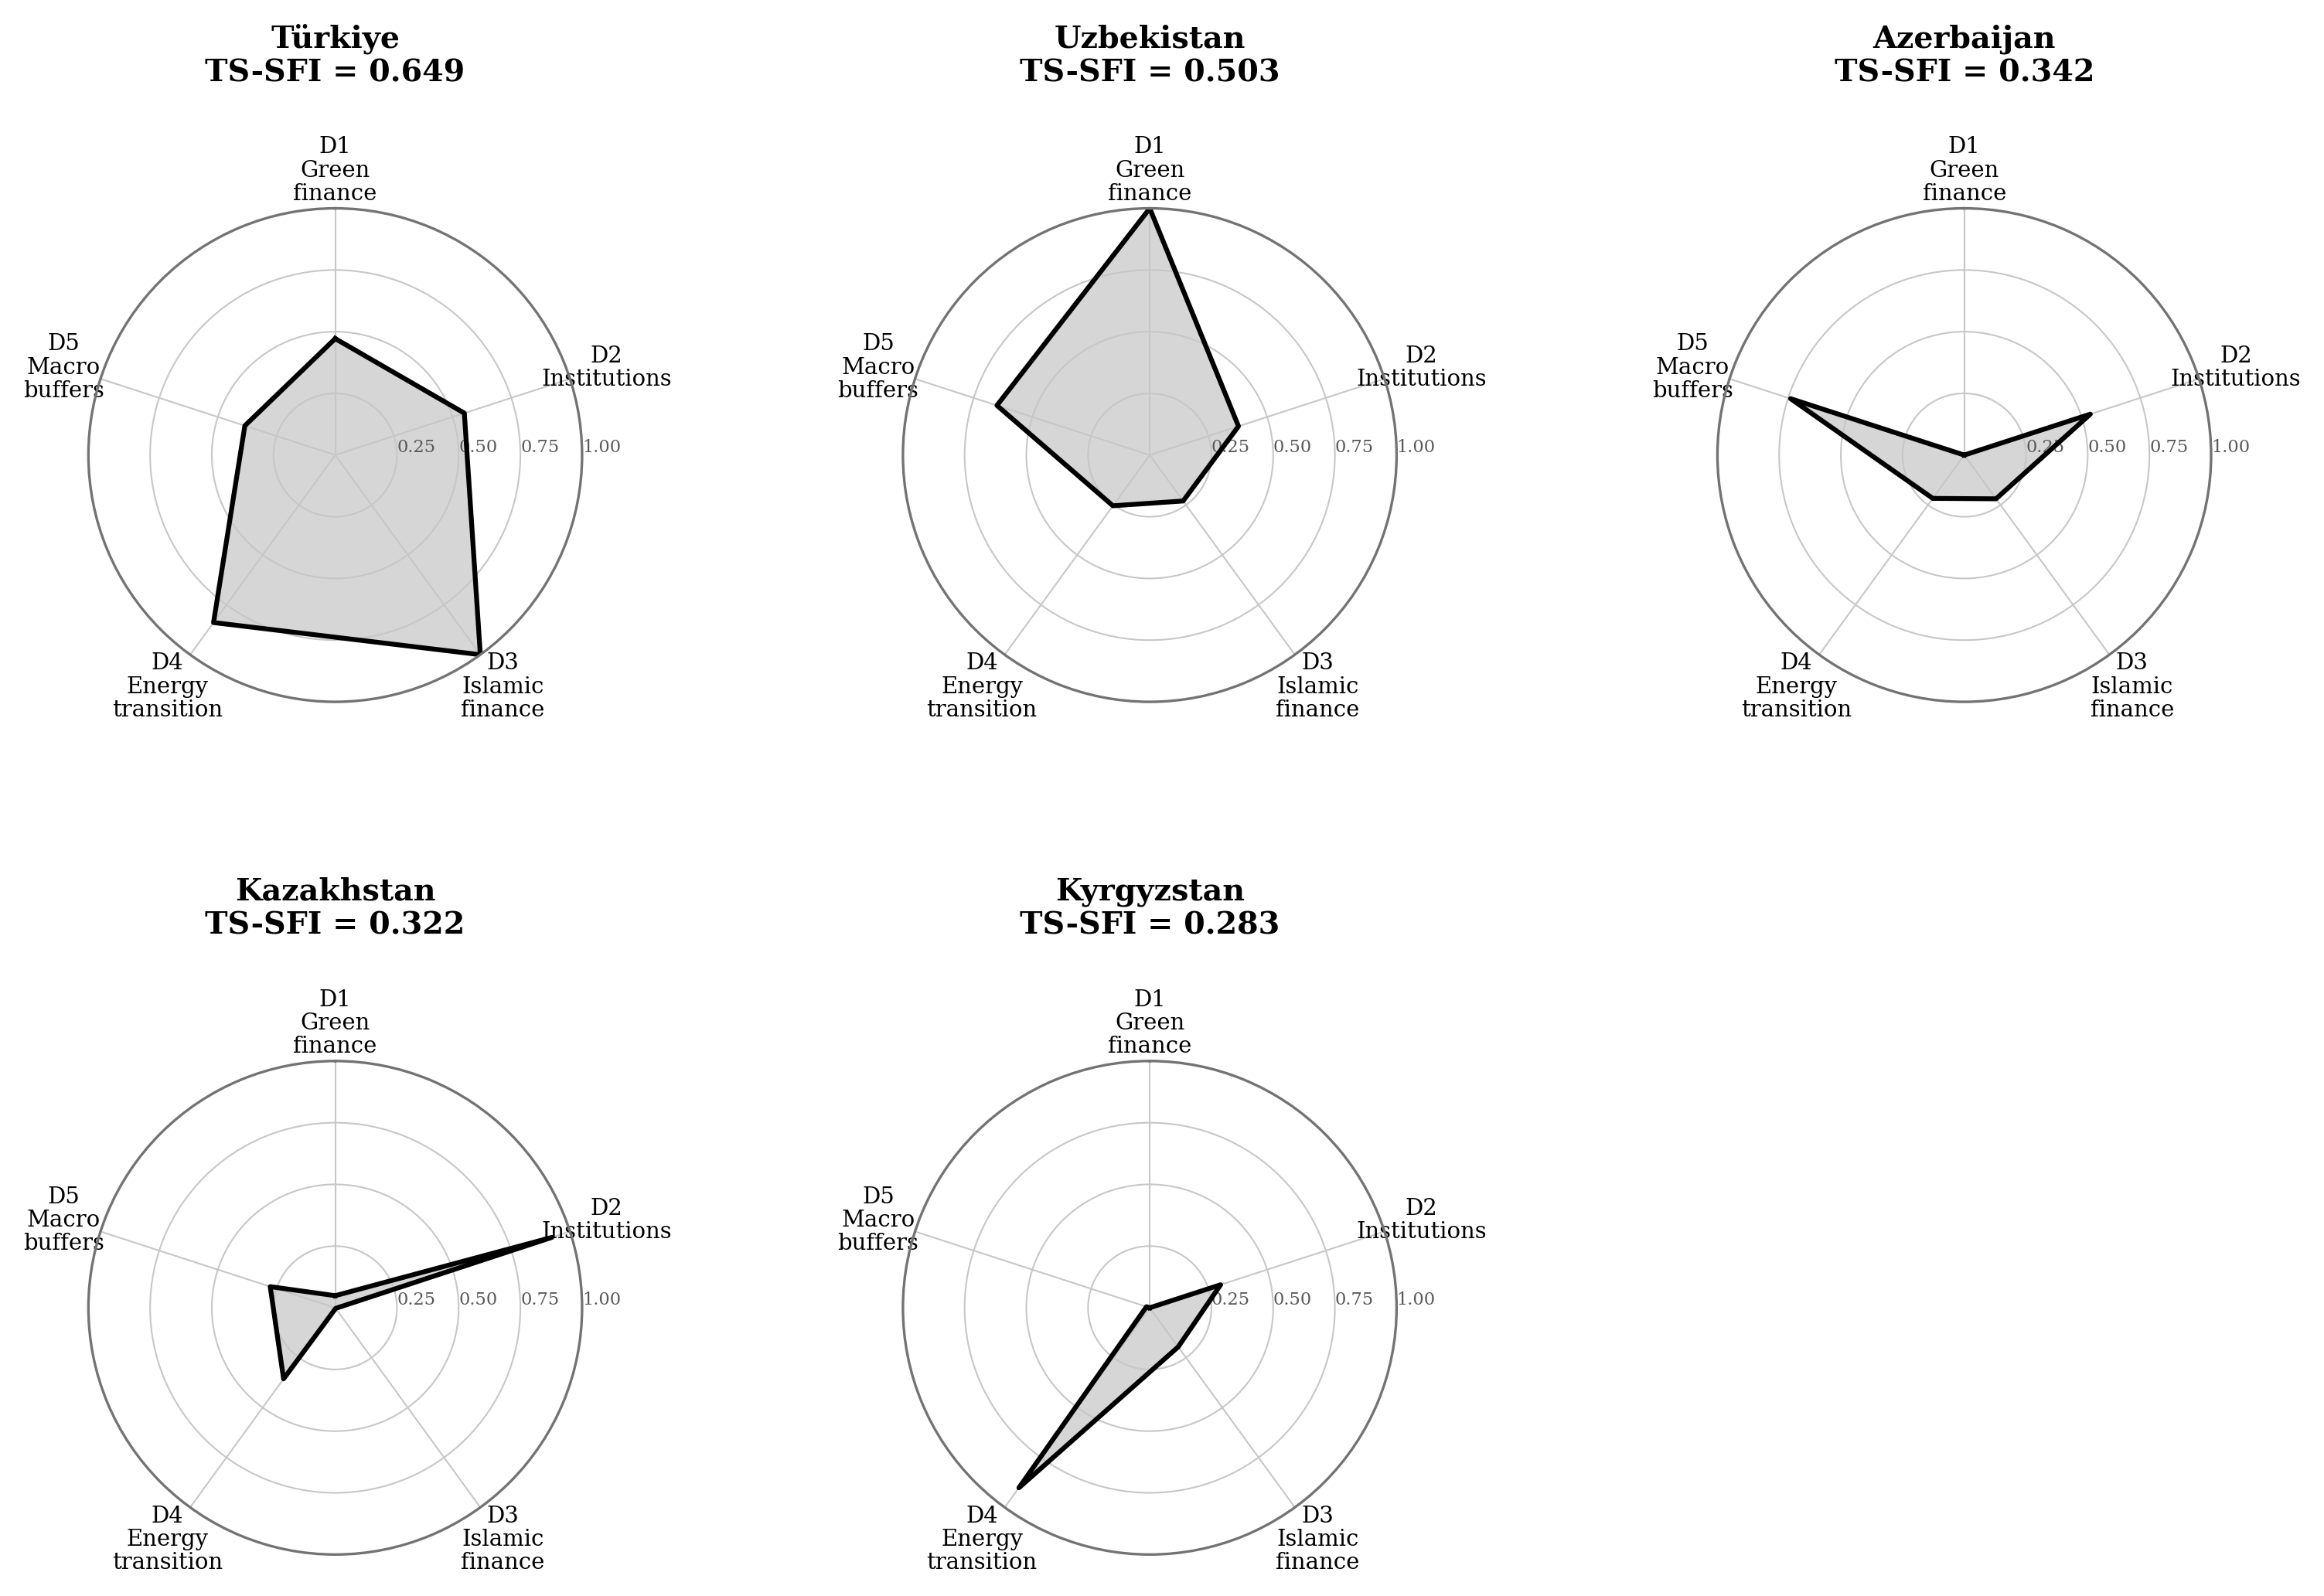
Figure 2. Country profiles across the five TS-SFI dimensions (Source: Author’s calculations; dimension scores from Table 1).
Which Dimensions Drive the Index
Equal weighting does not imply that each dimension contributes equally to observed differences; Appendix 2 (Table A4) reports two diagnostics. Islamic finance potential (D3) and green finance capacity (D1) are the dimensions most strongly correlated with the composite (0.864 and 0.697) and together account for roughly 83 percent of the composite’s variance, whereas the institutional dimension (D2) is essentially uncorrelated with the composite (−0.108). Two features explain the weak contribution of D2: cross-country variation in institutional scores is small—the five members occupy a compressed range on the WGI 0–100 scale (rule of law spans only 41.0–49.4)—so normalised differences translate into little raw separation; and Kazakhstan, the country with the strongest institutions, has almost no scale-adjusted market depth. In other words, rank separation is driven mainly by the two market-depth dimensions, on which Türkiye and—after scale adjustment—Uzbekistan stand out: where several countries sit near zero on a dimension and one or two sit near one, that dimension dominates the composite even under equal nominal weights. The index therefore primarily separates markets with observable labelled activity from markets without it.
Dimension-Level Interpretation
Green finance capacity (D1) is the main separator. Zero or near-zero D1 values for three members are consistent with the broader pattern that labelled instruments, especially green bonds, remain concentrated in a narrow set of issuing jurisdictions (Aneja et al. 7–8). The scale adjustment changes the reading of the leaders, however: in absolute terms Türkiye’s cumulative issuance (US$19.9 billion) dwarfs Uzbekistan’s (US$4.0 billion), but relative to GDP the ordering reverses, indicating that Uzbekistan’s sovereign-led issuance of 2023–2024 represents genuine market formation rather than a marginal event. Kazakhstan’s issuance remains small relative to its economy (0.18 percent of GDP) despite active institution-building (Astana International Financial Centre, Green Finance Market 3), and UNDP notes that green financial products in Kyrgyz institutions are only beginning to form, consistent with a true zero (UNDP 64).
Institutional quality (D2) follows a different logic. Kazakhstan’s relatively high governance scores show that regulatory architecture can advance even where market depth is limited; institutional engagement is an observable axis of development distinct from market size (D’Orazio and Thole 2–4; Abazov et al. 22–24). That D2 is uncorrelated with the composite is itself informative: institutional capacity is a necessary enabling condition, not a sufficient one.
Islamic finance potential (D3) operates through a distinct mechanism. Sukuk and waqf-linked instruments can support environmental and social objectives when governance and reporting are credible (Sunarya and Rusydiana 197–198). Türkiye has by far the strongest D3 score—participation-banking assets of 6.9 percent of GDP, sukuk outstanding of 1.8 percent, and the only dedicated regulatory framework—while penetration elsewhere is minimal (at most 0.45 percent of GDP in Kyrgyzstan), so the dimension separates one developed participation-finance market from four latent ones. Consistent with Section 3.4, this pillar is read as mobilisation capacity that complements rather than substitutes for market depth.
Energy-transition readiness (D4) and external buffers (D5) jointly clarify sequencing and vulnerability. Kyrgyzstan’s high D4 indicates favourable structural readiness—a renewable-heavy electricity mix and low carbon intensity—yet its near-zero D5 shows that such endowments coincide with acute external fragility (a current-account deficit exceeding 40 percent of GDP in 2022 and reserves of about three months of imports). Azerbaijan presents the mirror image: comfortable external buffers from hydrocarbon revenues (a 29.8 percent current-account surplus and low external debt) alongside no labelled market activity. Uzbekistan shows that buffers and market formation can advance together while institutions lag. This contrast illustrates why the index must be read as a profile: favourable endowments and strong buffers do not by themselves produce market depth or transition progress, which require project pipelines, instruments, and credible reporting in parallel (UNDP 64; Organization of Turkic States 3).
Robustness
The robustness battery in Appendix 2 separates three layers of stability. First, the leading pair is stable: Türkiye ranks first and Uzbekistan second under the headline design, alternative dimension weights (0.651 and 0.544), z-score standardisation (+0.684 and +0.156), the V-Dem institutional variant, and the per-capita variant in Table A5. Second, the composition of the leaders’ strength is transparent. In the leave-one-dimension-out battery (Table A3) Türkiye remains first in four of five variants (0.602–0.715), but excluding the Islamic finance dimension lifts Uzbekistan marginally above it (0.571 versus 0.561), so Türkiye’s edge rests on participation-finance depth; Uzbekistan’s second place rests on market depth itself—it falls to fourth when Dimension 1 is excluded. Third, the design variants quantify how much construction choices matter. Reinstating absolute dollar volumes drops Uzbekistan to fourth and lifts Azerbaijan to second, because absolute volumes reward large economies and dollar-level reserves; scaling market size per capita instead of by GDP preserves the leading pair, because Türkiye’s per-capita issuance (US$233) exceeds Uzbekistan’s (US$111) even though the GDP ratio favours Uzbekistan; and rebuilding the institutional dimension from the V-Dem rule-of-law index lifts Kyrgyzstan from fifth to third while lowering Azerbaijan to fifth, because the two institutional sources weight legal enforcement and civil-administration quality differently. Two entropy-weighted variants (Table A6) mark the boundary of this stability: dimension-level entropy weights, which load 46 percent of the total weight onto D1, lift Uzbekistan narrowly above Türkiye (0.654 versus 0.637), whereas indicator-level entropy weights restore Türkiye’s clear lead (0.764 versus 0.262). That two standard implementations of the same scheme disagree even on the leader confirms the argument of Section 4.6 for fixed equal weights. Excluding the Muslim population share indicator (Table A6) leaves the leading pair unchanged (0.649 and 0.457) and only swaps Azerbaijan and Kazakhstan within the cluster. Across all fixed-weight, ratio-based designs the identity and order of the leading pair are undisturbed, and Azerbaijan, Kazakhstan, and Kyrgyzstan remain a closely packed cluster whose internal order is specification-dependent. Reporting this sensitivity openly identifies the conclusions a policy audience can rely on—the leading pair, the source of each leader’s strength, and the binding constraint within each profile—and those it cannot.
Policy Implications and Future Agenda for the Turkic States
TS-SFI results can be read together with the Turkic Green Vision, which highlights cooperation on sustainable development and on financing and investment (Organization of Turkic States 3). Because the index separates markets with observable labelled activity from a clustered early-stage group, its policy value lies less in ranking the cluster than in identifying each member’s specific bottleneck.
Using TS-SFI as a Regional Coordination Tool
TS-SFI supports coordination in three ways: as a diagnostic baseline that clarifies where each country is strong or constrained across the five pillars; as a monitoring device once updated periodically, consistent with indices used for cross-country monitoring (GFLAC 3; Lofts and Meekings 5); and as a shared language for dialogue among ministries, central banks, supervisors, development banks, and private actors, which supports coordinated sequencing.
Priorities at the OTS and Regional Level
Each regional priority below is anchored to a specific empirical finding of the index.
A shared knowledge and data platform. The empirical basis is the data environment of Sections 4.7 and 4.8: market-depth data had to be assembled from mixed sources, one series contained a unit-scale error, and labelled markets could be verified as true zeros only through regional diagnostics. UNDP’s Kyrgyz assessment likewise underscores the value of structured roadmaps addressing supply- and demand-side conditions (UNDP 9). A practical OTS initiative is a Turkic Sustainable Finance Knowledge Hub curating training modules, common data definitions, and periodic TS-SFI updates—directly addressing the data gaps encountered in constructing the index.
Common minimum rules for taxonomies and disclosure. The empirical basis is the D1 pattern in Table 1: three of five members record no or negligible labelled issuance, and credible labels are a precondition for the market formation that separates the leaders. In Kyrgyzstan, the Green Finance Centre is developing a taxonomy of green projects (UNDP 14), and regional work in Central Asia stresses ESG disclosure as part of the sustainable finance architecture (Astana International Financial Centre, State of Sustainable Finance 16). A feasible OTS deliverable is a minimum taxonomy and disclosure guideline, internationally legible yet workable for national regulators, with a phased implementation roadmap.
Islamic finance channels for sustainable investment. The empirical basis is the D3 pattern: outside Türkiye, participation-finance penetration is below half a percent of GDP everywhere despite predominantly Muslim populations—a large gap between latent demand and institutional supply. Regional recommendations highlight sovereign green sukuk as a scalable instrument (Astana International Financial Centre, State of Sustainable Finance 39; Sunarya and Rusydiana 197–198). A regional framework can standardise use-of-proceeds categories, Shariah governance expectations, and impact reporting for green sukuk and related structures—the concrete channel through which the latent capacity captured in Dimension 3 could become realised sustainability performance.
Coordinated energy-transition investment. The empirical basis is the D4–D5 contrast identified in Section 5.3: the member with the strongest transition readiness (Kyrgyzstan, D4 = 0.902) has the weakest buffers (D5 = 0.014), so its readiness is financeable only with external risk-sharing. Cross-border cooperation can focus on bankable pipelines in renewables and efficiency, with grid coordination and risk-lowering financing structures (Çallıoğlu 2; Abazov et al. 4). TS-SFI profiles can help prioritise projects where readiness is high but financing constraints bind—most visibly Kyrgyzstan.
Country-Level Policy Directions
TS-SFI is not a full country strategy; it signals where, within each profile, the binding constraint lies.
Türkiye. Türkiye shows the broadest market profile (D3 = 1.000, D4 = 0.839, and the region’s largest absolute labelled market, D1 = 0.472) but mid-range buffers (D5 = 0.385, with external debt around half of GNI and reserves below four months of imports). Priorities combine consolidation with resilience: deepening green and sustainability-linked markets, strengthening impact reporting, and scaling climate-aligned participation-finance instruments so that market leadership is not undermined by external vulnerability.
Uzbekistan. The profile pairs the deepest scale-adjusted market depth in the sample (D1 = 1.000; cumulative issuance of 3.7 percent of GDP) and comfortable buffers (D5 = 0.651) with the weakest energy-transition indicators (D4 = 0.254, including the highest carbon intensity in the sample) and modest institutional scores (D2 = 0.378). The binding constraint is converting issuance momentum into durable market infrastructure: the OECD recommends a consolidated capital-market law to reduce uncertainty for issuers and investors (OECD 17), and channelling labelled-market momentum toward the energy sector would address the transition gap directly.
Azerbaijan. The profile pairs the strongest buffers (D5 = 0.740) with no labelled market activity (D1 = 0.000), so the binding constraint is market and capability formation rather than macro space. Priorities centre on corporate and financial-sector capability building: survey evidence shows familiarity with ESG trends but limited understanding of their organisational impact (PwC 18), so disclosure pilots should focus on practical routines, clear data ownership, and gradually expanding scope.
Kazakhstan. The profile points to a clear gap between the strongest institutions in the sample (D2 = 0.923) and thin scale-adjusted markets (D1 = 0.049; D3 = 0.003). Priorities follow from converting institutional capacity into issuance: accelerating green-taxonomy implementation, strengthening project pipelines, and expanding the use of green instruments as part of the transition-financing toolkit (Abazov et al. 25).
Kyrgyzstan. The profile combines the highest energy-transition readiness (D4 = 0.902) with the weakest external buffers (D5 = 0.014); its bottom composite position reflects this fragility, not an absence of transition potential. UNDP highlights risk-sharing and blended finance (UNDP 3) alongside green-taxonomy work (UNDP 14); a TS-SFI-informed agenda should align concessional-finance mobilisation with debt management and macro-financial safeguards.
TS-SFI as a Research and Data Agenda
Constructing TS-SFI revealed data gaps in climate-risk disclosure, supervisory metrics, and granular green-credit data—and, in one instance, a unit-scale inconsistency that had to be corrected against the harmonised World Bank measure. The regional policy agenda already includes prudential tools such as climate stress testing (Astana International Financial Centre, State of Sustainable Finance 33). A practical next step is to pair TS-SFI updates with a shared data protocol and modular extensions (banking, capital markets, Islamic finance) so that the index evolves from a cross-sectional benchmark into a durable time-series reference for regional coordination and research.
Conclusion
This article develops TS-SFI as a composite measurement framework for the five OTS member states: a transparent tool to compare sustainable finance readiness across the region, accompanied by an explicit account of what the resulting profile can and cannot support.
Main Findings
Three findings follow from the country profiles. First, market depth remains the main separator, but scale adjustment changes what it shows: relative to GDP, Uzbekistan has the deepest labelled market in the sample and is the robust runner-up, while Türkiye leads the composite in every fixed-weight specification through the breadth of its profile—participation-finance depth, energy-transition readiness, and the largest absolute labelled market. Second, the remaining three members form a closely clustered group whose internal ordering is sensitive to construction choices; institutional readiness, energy-transition readiness, and external buffers each peak in a different country (Kazakhstan, Kyrgyzstan, and Azerbaijan, respectively), so no single development path dominates. Third, favourable conditions on one dimension do not translate automatically into others: a renewable-heavy energy mix coincides with acute external fragility in Kyrgyzstan, strong buffers coincide with an absent labelled market in Azerbaijan, and emerging market depth coincides with the weakest transition indicators in Uzbekistan. The robustness battery in Appendix 2 confirms that the leading pair and the dominant role of market depth are stable—Türkiye’s edge resting on participation-finance depth—while middle ranks shift in expected ways.
Contributions to the Literature
The article contributes in three ways. First, it proposes a region-specific index that combines scale-adjusted green finance markets with institutional readiness, Islamic finance potential, energy-transition conditions, and external vulnerability, positioned explicitly against existing indices (Appendix 3, Table A7). Second, it shows that a methodologically simple construction can remain operationally useful in a small-sample setting when indicator mapping, direction rules, scale adjustment, data exceptions, and—critically—the sensitivity of the ordering are reported transparently. Third, it adds comparable regional evidence by placing country-level strengths and constraints into a consistent cross-country structure rather than relying on isolated country diagnostics.
Policy Relevance for the OTS
TS-SFI is designed for diagnostic and monitoring use. One distinction governs how the index should be quoted: it measures the readiness and enabling environment for sustainable finance, not realised sustainability performance. A high score does not certify that financial flows are currently producing verified environmental or social outcomes, and a low score signals missing preconditions rather than the absence of transition effort. Within this scope, the index provides a structured basis for identifying binding constraints and for supporting cooperation under the Turkic Green Vision (Organization of Turkic States 3), and Section 6 sets out the corresponding regional and country-level priorities.
Limitations and Avenues for Further Work
TS-SFI is limited by its small country set and cross-sectional design; measurement error, the single labelled-market indicator behind green finance capacity, and the partial coverage of the social pillar are acknowledged in Section 4.8. These limits suggest a concrete research agenda. First, a dynamic, time-series version of TS-SFI is the natural next step: annual recomputation would allow analysis of change over time and of the association between readiness and transition outcomes such as emissions intensity and energy efficiency. Such a panel is also the precondition for econometric validation: with a single cross-section of five countries, regressions of TS-SFI scores on outcomes would carry no statistical information and would be partly circular wherever the outcome—carbon intensity, for example—already enters the index. Second, alternative weighting schemes—entropy-based weighting (Jiang et al. 1) and multi-criteria approaches such as fuzzy AHP or the fuzzy Best-Worst Method (Aytekin and Gündoğdu 16; Ateş and Usman 34; Altıntaş 2)—can be examined once more indicators and periods are available. Third, the indicator set can be broadened as data mature: finance-side transition indicators (green lending, climate-related disclosure) could replace energy outcomes in Dimension 4; a dedicated social-finance dimension (separately reported social bonds, financial inclusion) would complete the ESG triad; and a climate-finance-vulnerability refinement of Dimension 5 (adaptation costs, access to international climate funds, climate-risk insurance) would sharpen its link to sustainable finance. Sectoral sub-indices for banking, capital markets, and Islamic finance could provide more granular diagnostics. Despite these constraints, TS-SFI provides a transparent and regionally relevant starting point for benchmarking sustainable finance readiness across the Turkic States.
Conflict of Interest Statement
There is no conflict of interest with any institution or person within the scope of this study.
Appendix 1
Table A1
TS-SFI Indicators: Definitions, Directions, Sources, Years, and Data Notes
| Code | Indicator (unit) | Direction | Source | Year | Data notes |
|---|---|---|---|---|---|
| D1.1 | Cumulative labelled green, social, sustainability and sustainability-linked (GSSS) bond issuance, % of 2023 GDP | Higher better | IMF Climate Change Indicators; World Bank WDI (GDP) | 2022–2024 | Cumulative over the window to capture market depth in a thin, lumpy market; scaled by mid-window (2023) GDP. Sovereign sub-series are excluded from the aggregate to avoid double counting. Azerbaijan and Kyrgyzstan record no labelled issuance in any year and are coded as true zeros, confirmed against regional sources; Uzbekistan records issuance in 2023–2024. |
| D2.1 | Rule of law (WGI governance score, 0–100) | Higher better | World Bank, WGI | 2022 | Captures impartial enforcement and constraints on executive power. |
| D2.2 | Regulatory quality (WGI governance score, 0–100) | Higher better | World Bank, WGI | 2022 | Standard governance score. All five members also report a national green/sustainable finance strategy; because this indicator is constant across the sample it is recorded as context and excluded from the index. |
| D2.3 | Control of corruption (WGI governance score, 0–100) | Higher better | World Bank, WGI | 2022 | Integrity of project selection and use-of-proceeds verification. |
| D2.4 | Voice and accountability (WGI governance score, 0–100) | Higher better | World Bank, WGI | 2022 | Societal demand and accountability channels for sustainability commitments. |
| D3.1 | Islamic banking assets (% of 2022 GDP) | Higher better | TKBB (Türkiye); IFSB PSIFIs (Kyrgyzstan); Forbes Kazakhstan bank-ranking profiles of Al Hilal Islamic Bank (ADCB) and Zaman-Bank (Kazakhstan); World Bank WDI (GDP) | 2022 | Türkiye: participation-banking assets of TRY 1,187.6 billion at end-2022 (TKBB; identical to IFSB PSIFIs 2022Q4), converted at the year-end exchange rate. Kyrgyzstan: total assets of the sole full-fledged Islamic bank (IFSB PSIFIs 2022Q4; Islamic windows excluded). Kazakhstan: combined end-2022 total assets of the two licensed Islamic banks (Al Hilal Islamic Bank KZT 60.3 billion and Zaman-Bank KZT 36.0 billion, as reported in the Forbes Kazakhstan bank-ranking profiles), converted at the year-end exchange rate. Azerbaijan and Uzbekistan: no licensed Islamic bank in 2022, coded as true zero. Scaled by 2022 GDP. |
| D3.2 | Sukuk outstanding (% of 2022 GDP) | Higher better | ICD / LSEG; World Bank WDI (GDP) | 2022 | Zero values retained as recorded; scaled by 2022 GDP. |
| D3.3 | Islamic finance regulation dummy | Higher better | IFSB | 2022 | 1 if a dedicated legal/regulatory framework exists, else 0. |
| D3.4 | Muslim population share (0–1) | Higher better | Pew Research Center | 2022 | Latent-demand proxy; limited discriminatory power in this sample (Section 3.4). |
| D4.1 | Renewables in energy consumption (0–1) | Higher better | International Energy Agency | 2022 | Used in share form. |
| D4.2 | Renewable electricity generation per capita (kWh) | Higher better | Our World in Data | 2022 | — |
| D4.3 | Carbon intensity of GDP (kg CO₂e per 2021 PPP$) | Lower better (inverted) | World Bank, EN.GHG.CO2.RT.GDP.PP.KD | 2022 | Harmonised single-unit series used for all five countries; this World Bank measure was adopted to ensure a consistent unit definition across the sample. |
| D4.4 | Net-zero / long-term strategy dummy | Higher better | Net Zero Tracker | 2022 | 1 if a net-zero/long-term strategy exists, else 0. |
| D5.1 | External debt stocks (% of GNI) | Lower better (inverted) | World Bank, WDI | 2022 | Used in ratio form. |
| D5.2 | Current account balance (% of GDP) | Higher better | World Bank, WDI | 2022 | Negative values retained as recorded. |
| D5.3 | Total reserves in months of imports | Higher better | World Bank, WDI | 2022 | Ratio-based adequacy measure; the dollar level of reserves is used only in the levels robustness variant (Table A5). The level of GDP is deliberately excluded from this dimension (see Section 3.6). |
Note: Each indicator is assigned to a single dimension. Dummy variables are used directly; all other indicators are min–max normalised across the five countries, with “lower is better” indicators inverted before aggregation (Section 4.5). GDP denominators are 2022 GDP for 2022-dated indicators and 2023 GDP for the cumulative 2022–2024 issuance stock (Section 4.1).
Appendix 2
Replication and robustness checks
This appendix provides (i) a concise replication note and (ii) the robustness outputs referenced in Sections 4.8 and 5. All quantities are computed from the indicator matrix documented in Appendix 1 (Table A1); the input data and a short script that reproduces every table are available in the replication materials.
A2.1 Replication inputs and coding rules. The replication dataset is a country-by-indicator matrix covering the sixteen TS-SFI indicators. Market-size indicators enter as ratios: cumulative 2022–2024 labelled issuance as a percentage of 2023 GDP, Islamic banking assets and sukuk outstanding as percentages of 2022 GDP, and reserves in months of imports. Indicators stored as shares (0–1) are used in share form (Muslim population share, renewables share); the governance indicators are WGI scores on a 0–100 scale (2022). Dummy variables are coded 0/1 and used directly. The absolute dollar levels underlying the ratios, together with GDP and population denominators and the V-Dem rule-of-law series, are retained in the replication materials for the design variants in Table A5. Entropy weights (Table A6) are computed from the min–max normalised matrix as w_j ∝ 1 − e_j, where e_j is the Shannon entropy of the column shares; the indicator-exclusion variant removes D3.4 and rebuilds Dimension 3 from its remaining three indicators.
Table A2
Robustness of the Ordering under Alternative Weights and Z-Score Aggregation
| Country | TS-SFI | Rank | Alt-weight | Rank | z-score | Rank |
|---|---|---|---|---|---|---|
| Türkiye | 0.649 | 1 | 0.651 | 1 | +0.684 | 1 |
| Uzbekistan | 0.503 | 2 | 0.544 | 2 | +0.156 | 2 |
| Azerbaijan | 0.342 | 3 | 0.264 | 5 | −0.173 | 4 |
| Kazakhstan | 0.322 | 4 | 0.282 | 4 | −0.171 | 3 |
| Kyrgyzstan | 0.283 | 5 | 0.339 | 3 | −0.496 | 5 |
Note: “Alt-weight” assigns 0.30 to D1 and 0.30 to D4 and 0.1333 to each of D2, D3, and D5. “z-score” standardises each dimension across the five countries before aggregation (values are not on a 0–1 scale, but ranks are comparable).
Table A3
Leave-One-Dimension-Out Sensitivity (Composite Score; Rank in Parentheses)
| Country | Excl. D1 | Excl. D2 | Excl. D3 | Excl. D4 | Excl. D5 |
|---|---|---|---|---|---|
| Türkiye | 0.693 (1) | 0.674 (1) | 0.561 (2) | 0.602 (1) | 0.715 (1) |
| Uzbekistan | 0.378 (4) | 0.534 (2) | 0.571 (1) | 0.565 (2) | 0.466 (2) |
| Azerbaijan | 0.428 (2) | 0.294 (3) | 0.373 (4) | 0.374 (3) | 0.243 (5) |
| Kazakhstan | 0.390 (3) | 0.171 (5) | 0.401 (3) | 0.313 (4) | 0.333 (4) |
| Kyrgyzstan | 0.354 (5) | 0.278 (4) | 0.305 (5) | 0.128 (5) | 0.350 (3) |
Note: Each column recomputes the composite as the average of the remaining four dimensions. Türkiye is first in four of the five variants; excluding the Islamic finance dimension (D3) lifts Uzbekistan marginally above Türkiye (0.571 versus 0.561), which shows that Türkiye’s edge within the leading pair rests on participation-finance depth. Uzbekistan is second in all other variants except the exclusion of Dimension 1, which confirms that its position rests on scale-adjusted market depth. The ordering of the other members shifts with the excluded dimension.
Table A4
Dimension Diagnostics: Association with the Composite and Variance Share
| Dimension | Corr. with TS-SFI | Variance share |
|---|---|---|
| D1 Green finance capacity | 0.697 | 0.397 |
| D2 Institutional and regulatory framework | −0.108 | −0.034 |
| D3 Islamic finance potential | 0.864 | 0.436 |
| D4 Energy-transition readiness | 0.189 | 0.081 |
| D5 External finance and macro-financial buffers | 0.312 | 0.119 |
Note: Variance shares decompose the variance of the composite by each dimension’s covariance with it under the baseline equal-weight index. D1 and D3 jointly account for about 83 percent of the variance; D2 is essentially uncorrelated with the composite because cross-country variation in governance scores is small and the country with the strongest institutions has almost no market depth (Section 5.2).
Table A5
Design-Variant Sensitivity: Institutional Source, Absolute Levels, and Per-Capita Scaling
| Country | Headline | Rank | V-Dem D2 | Rank | Levels | Rank | Per capita | Rank |
|---|---|---|---|---|---|---|---|---|
| Türkiye | 0.649 | 1 | 0.587 | 1 | 0.815 | 1 | 0.755 | 1 |
| Uzbekistan | 0.503 | 2 | 0.496 | 2 | 0.293 | 4 | 0.398 | 2 |
| Azerbaijan | 0.342 | 3 | 0.235 | 5 | 0.332 | 2 | 0.342 | 3 |
| Kazakhstan | 0.322 | 4 | 0.268 | 4 | 0.320 | 3 | 0.332 | 4 |
| Kyrgyzstan | 0.283 | 5 | 0.422 | 3 | 0.280 | 5 | 0.280 | 5 |
Note: “V-Dem D2” rebuilds Dimension 2 from the V-Dem rule-of-law index (Our World in Data) instead of the four WGI scores. “Levels” reinstates absolute dollar volumes for GSSS issuance, Islamic banking assets, sukuk outstanding, and reserves (the pre-revision design): Uzbekistan falls to fourth because absolute volumes reward large economies, which is the size bias the headline ratio design removes. “Per capita” scales the market-size indicators by population instead of GDP; the leading pair is unchanged because Türkiye’s per-capita issuance exceeds Uzbekistan’s. Türkiye is first and Uzbekistan second in every fixed-weight, ratio-based specification; the ordering of the remaining members is sensitive to these measurement choices, which is the basis for reading TS-SFI as a profile rather than a strict ranking.
Table A6
Data-Driven Weighting and Indicator-Exclusion Variants
| Country | Entropy (dimension level) | Rank | Entropy (indicator level) | Rank | D3 excl. Muslim share | Rank |
|---|---|---|---|---|---|---|
| Türkiye | 0.637 | 2 | 0.764 | 1 | 0.649 | 1 |
| Uzbekistan | 0.654 | 1 | 0.262 | 2 | 0.457 | 2 |
| Azerbaijan | 0.204 | 3 | 0.210 | 4 | 0.299 | 4 |
| Kazakhstan | 0.131 | 5 | 0.189 | 5 | 0.322 | 3 |
| Kyrgyzstan | 0.147 | 4 | 0.248 | 3 | 0.248 | 5 |
Note: Shannon-entropy weights are computed from the min–max normalised matrix, at the level of the five dimension scores (dimension level: D1 0.463, D2 0.040, D3 0.267, D4 0.089, D5 0.141) and at the level of the sixteen indicators (indicator level). Because entropy rewards dispersion, both variants concentrate weight on the market-depth dimensions, and the two implementations disagree even on the identity of the leader; this instability is the empirical basis for retaining fixed equal weights as the headline design (Section 4.6). The exclusion variant removes the Muslim population share (D3.4) and rebuilds Dimension 3 from its remaining three indicators: the leading pair is unchanged and only Azerbaijan and Kazakhstan swap places within the cluster.
Appendix 3
Table A7
TS-SFI and Existing Sustainable Finance Measurement Frameworks
| Framework | Geographical scope | Dimensional focus | Indicator basis | Intended use |
|---|---|---|---|---|
| Climate-related Financial Policy Index (D’Orazio and Thole) | Global, country level | Engagement in green financial policymaking | Adopted policies and instruments | Cross-country policy comparison |
| EY Sustainable Finance Index (Lofts and Meekings) | Global, country level | ESG-oriented sustainable finance progress | Aggregated cross-country indicators | Market benchmarking and gap analysis |
| GFLAC Sustainable Finance Index | Latin America and the Caribbean | Climate-relevant public finance and fiscal structure | National budget and finance data | Civil-society monitoring and advocacy |
| DJSI and ESG index families (Schmutz et al.; Tehrani et al.) | Global, firm level | Corporate sustainability performance | Firm-level ESG assessments | Investment screening and benchmarks |
| TS-SFI (this study) | Five OTS member states | Readiness profile: scale-adjusted green finance market depth, governance, Islamic finance potential, energy-transition context, macro-financial buffers | Country-level ratios from international databases | Regional diagnostic, monitoring, and coordination tool for the Turkic Green Vision |
Source: Authors’ compilation from the cited studies (D’Orazio and Thole 1; Lofts and Meekings 3–4; GFLAC 3; Schmutz et al. 1; Tehrani et al. 2).
Images, Figures and Tables
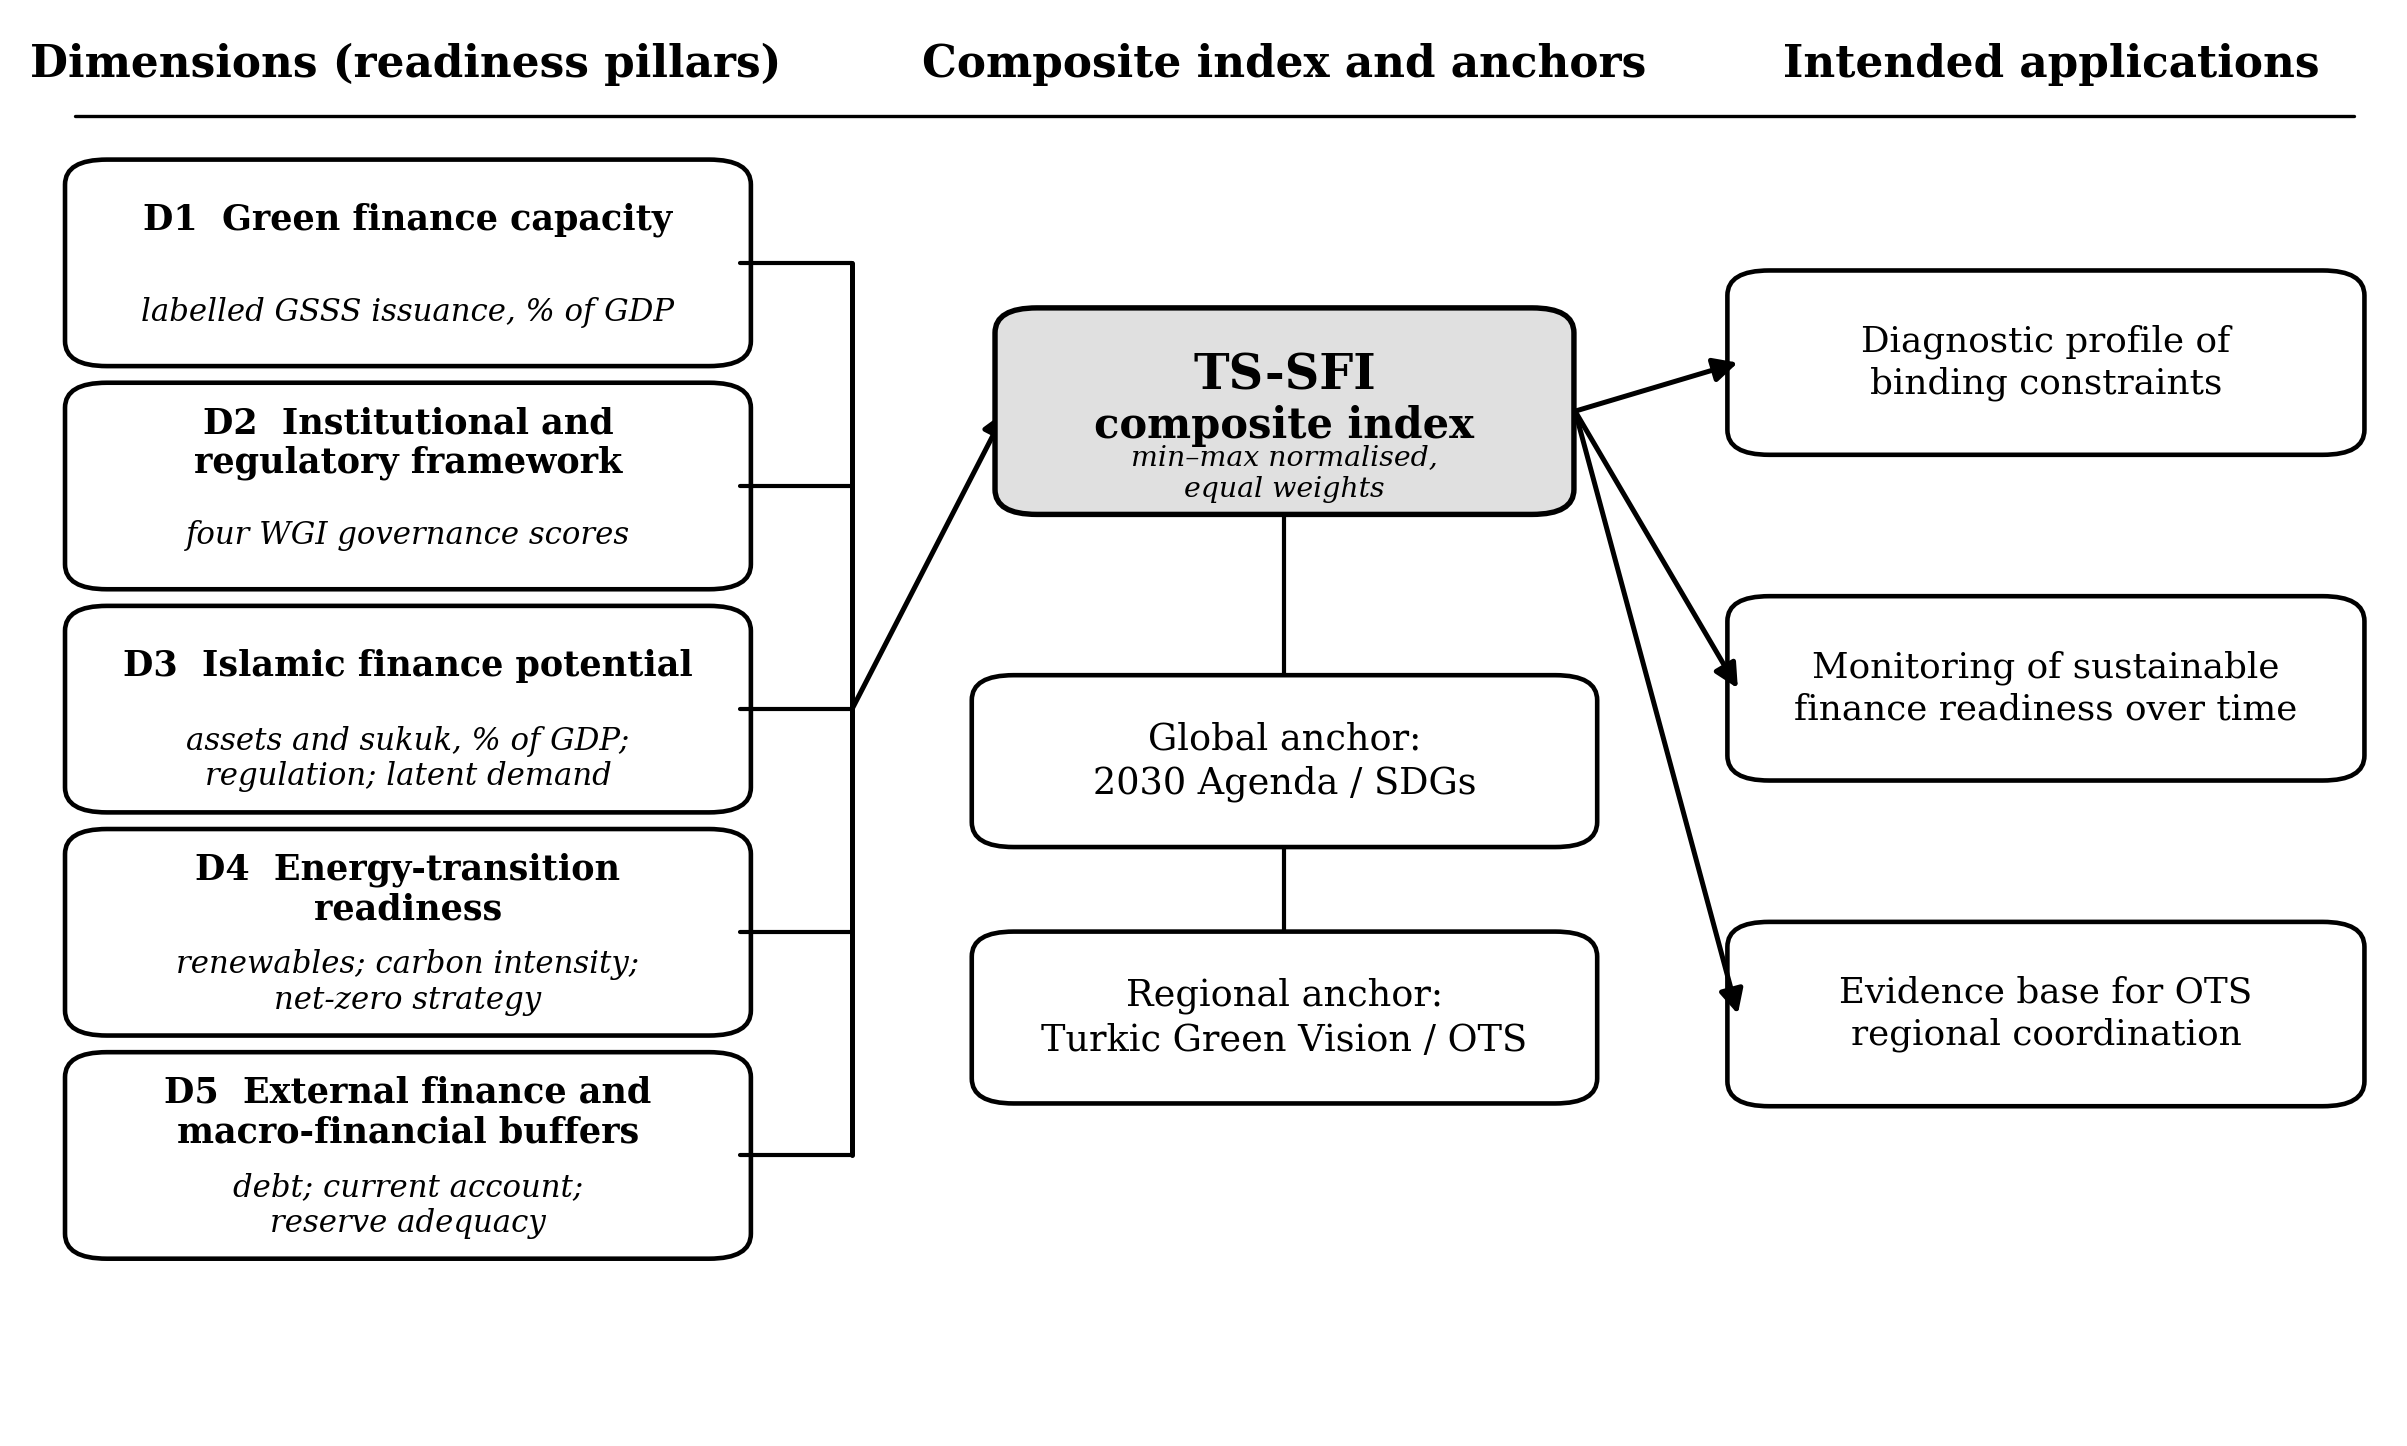
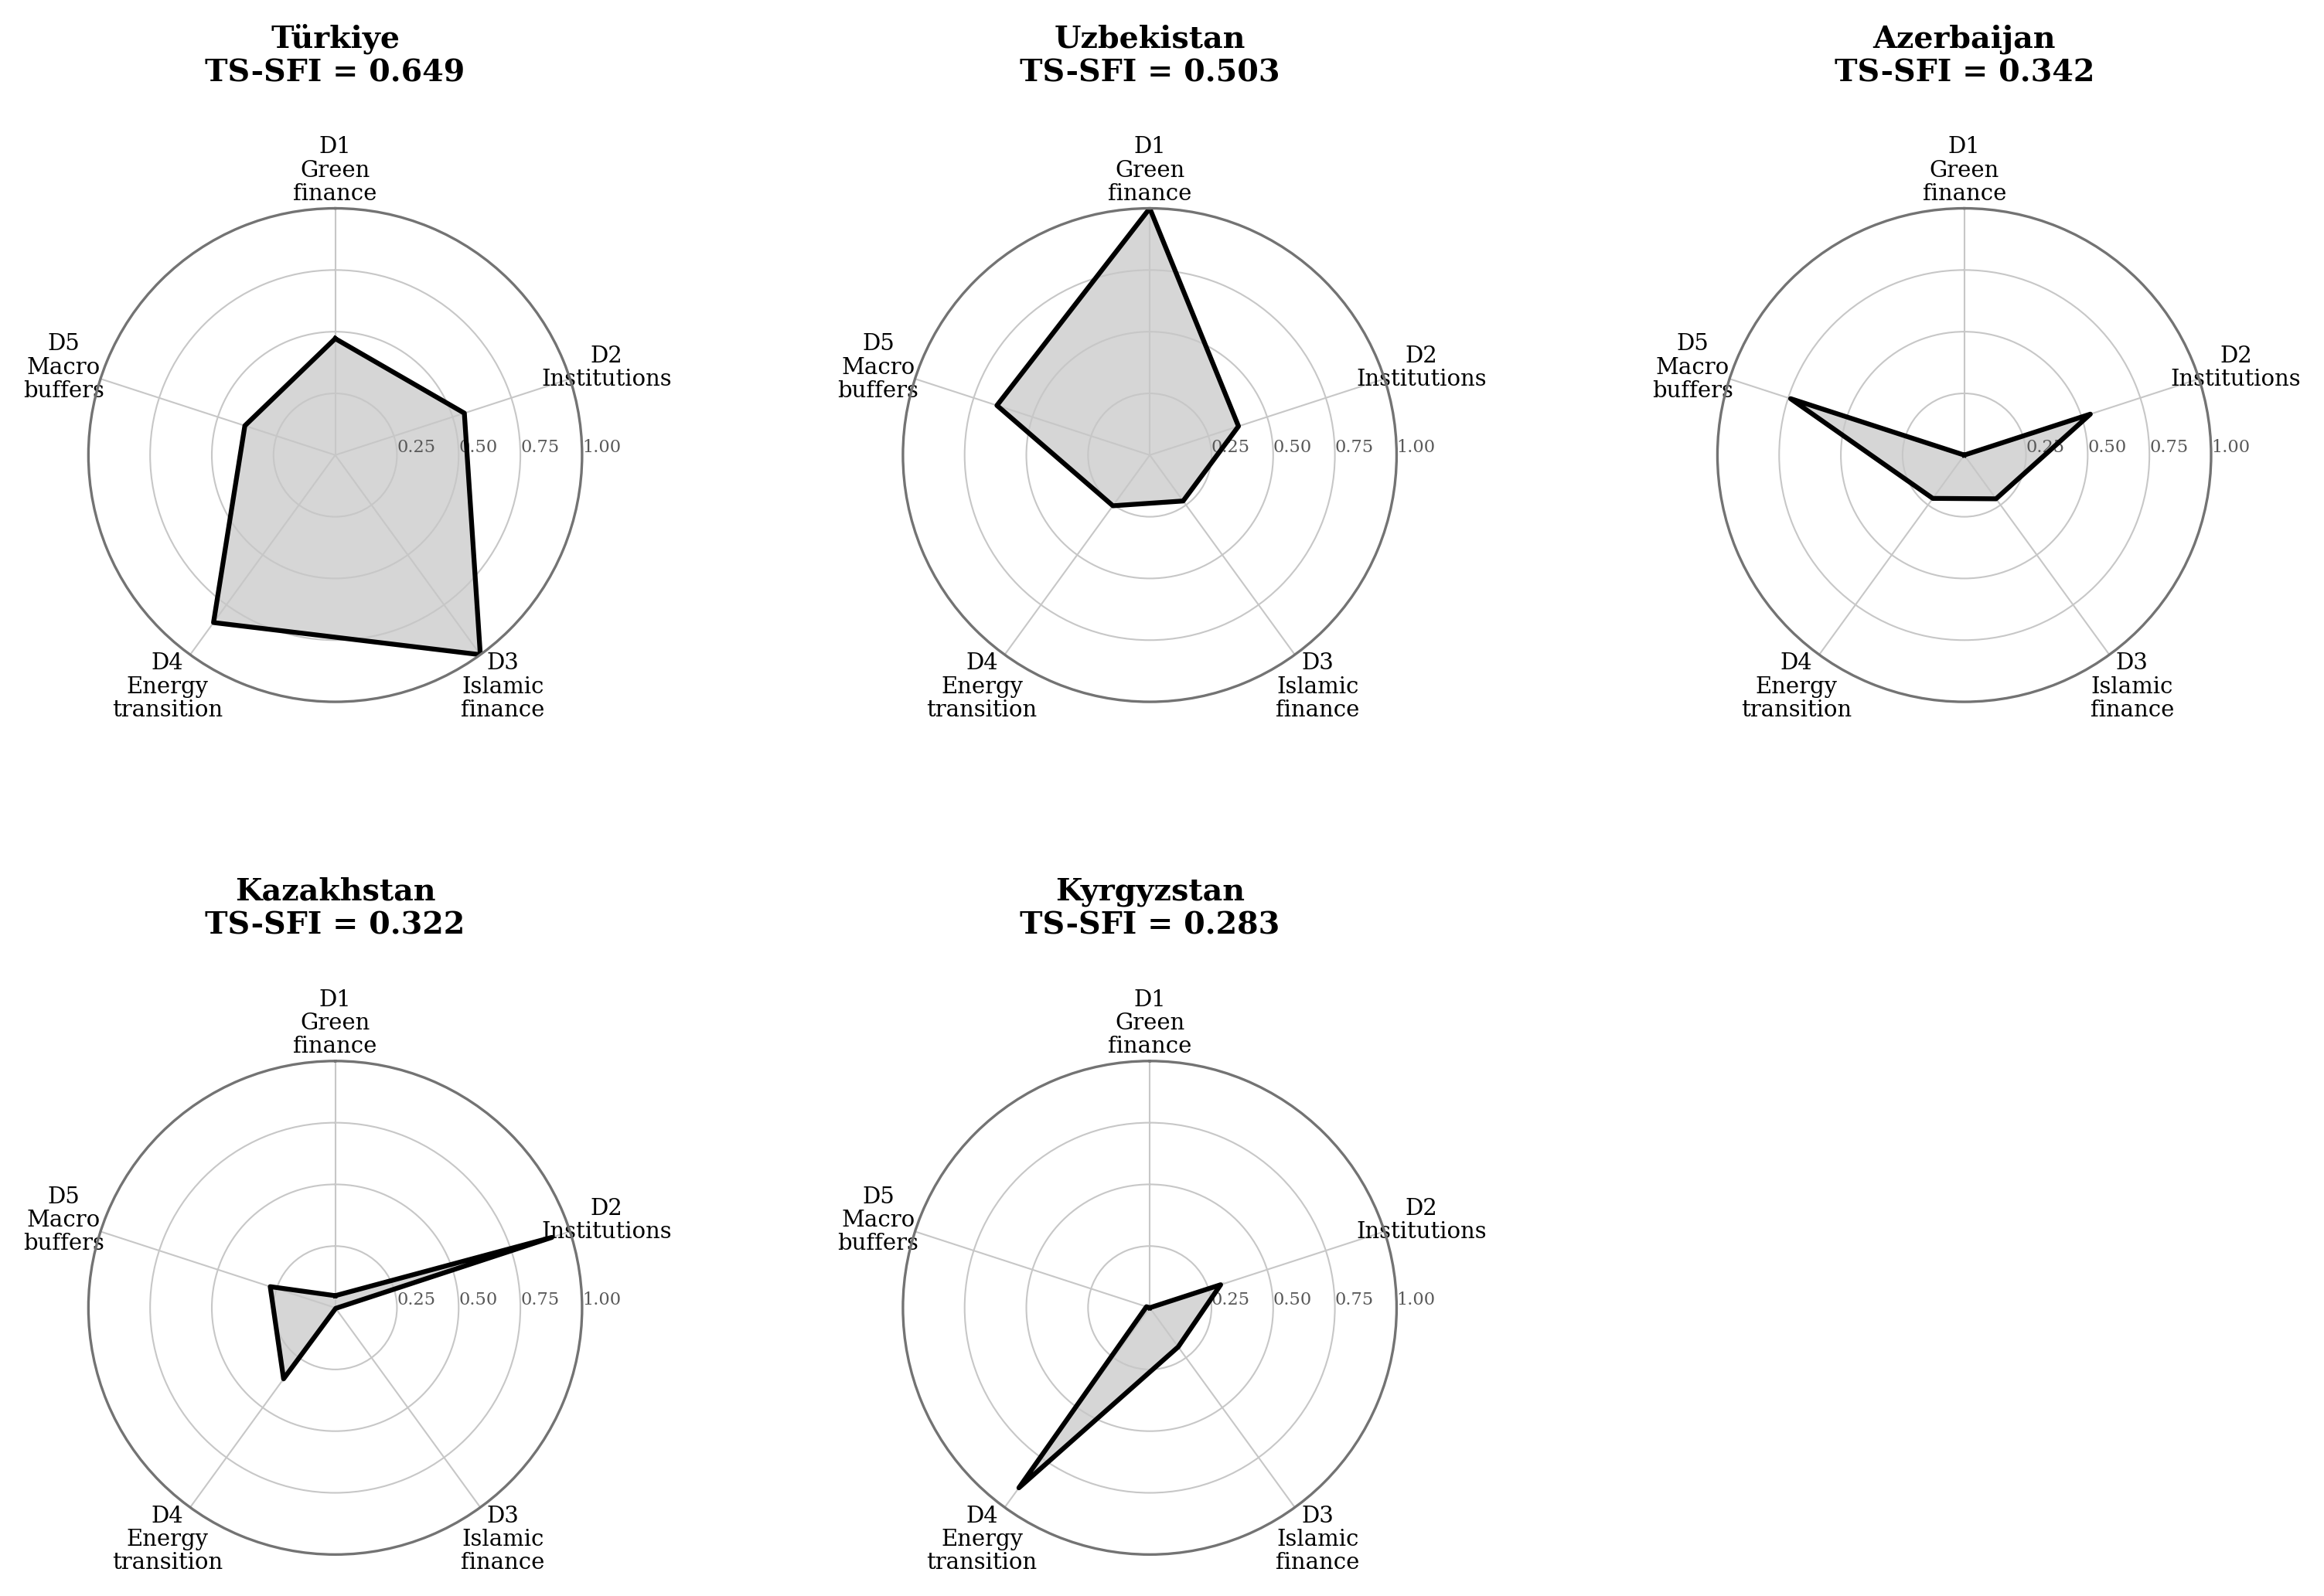
Table 1. TS-SFI and Dimension Scores (Min–Max Normalised, 0–1) Show tableHide table
| Country | D1 | D2 | D3 | D4 | D5 | TS-SFI | Rank |
|---|---|---|---|---|---|---|---|
| Türkiye | 0.472 | 0.550 | 1.000 | 0.839 | 0.385 | 0.649 | 1 |
| Uzbekistan | 1.000 | 0.378 | 0.230 | 0.254 | 0.651 | 0.503 | 2 |
| Azerbaijan | 0.000 | 0.537 | 0.219 | 0.217 | 0.740 | 0.342 | 3 |
| Kazakhstan | 0.049 | 0.923 | 0.003 | 0.356 | 0.277 | 0.322 | 4 |
| Kyrgyzstan | 0.000 | 0.302 | 0.196 | 0.902 | 0.014 | 0.283 | 5 |
Table A1 (Appendix 1). TS-SFI Indicators: Definitions, Directions, Sources, Years, and Data Notes Show tableHide table
| Code | Indicator (unit) | Direction | Source | Year | Data notes |
|---|---|---|---|---|---|
| D1.1 | Cumulative labelled green, social, sustainability and sustainability-linked (GSSS) bond issuance, % of 2023 GDP | Higher better | IMF Climate Change Indicators; World Bank WDI (GDP) | 2022–2024 | Cumulative over the window to capture market depth in a thin, lumpy market; scaled by mid-window (2023) GDP. Sovereign sub-series are excluded from the aggregate to avoid double counting. Azerbaijan and Kyrgyzstan record no labelled issuance in any year and are coded as true zeros, confirmed against regional sources; Uzbekistan records issuance in 2023–2024. |
| D2.1 | Rule of law (WGI governance score, 0–100) | Higher better | World Bank, WGI | 2022 | Captures impartial enforcement and constraints on executive power. |
| D2.2 | Regulatory quality (WGI governance score, 0–100) | Higher better | World Bank, WGI | 2022 | Standard governance score. All five members also report a national green/sustainable finance strategy; because this indicator is constant across the sample it is recorded as context and excluded from the index. |
| D2.3 | Control of corruption (WGI governance score, 0–100) | Higher better | World Bank, WGI | 2022 | Integrity of project selection and use-of-proceeds verification. |
| D2.4 | Voice and accountability (WGI governance score, 0–100) | Higher better | World Bank, WGI | 2022 | Societal demand and accountability channels for sustainability commitments. |
| D3.1 | Islamic banking assets (% of 2022 GDP) | Higher better | TKBB (Türkiye); IFSB PSIFIs (Kyrgyzstan); Forbes Kazakhstan bank-ranking profiles of Al Hilal Islamic Bank (ADCB) and Zaman-Bank (Kazakhstan); World Bank WDI (GDP) | 2022 | Türkiye: participation-banking assets of TRY 1,187.6 billion at end-2022 (TKBB; identical to IFSB PSIFIs 2022Q4), converted at the year-end exchange rate. Kyrgyzstan: total assets of the sole full-fledged Islamic bank (IFSB PSIFIs 2022Q4; Islamic windows excluded). Kazakhstan: combined end-2022 total assets of the two licensed Islamic banks (Al Hilal Islamic Bank KZT 60.3 billion and Zaman-Bank KZT 36.0 billion, as reported in the Forbes Kazakhstan bank-ranking profiles), converted at the year-end exchange rate. Azerbaijan and Uzbekistan: no licensed Islamic bank in 2022, coded as true zero. Scaled by 2022 GDP. |
| D3.2 | Sukuk outstanding (% of 2022 GDP) | Higher better | ICD / LSEG; World Bank WDI (GDP) | 2022 | Zero values retained as recorded; scaled by 2022 GDP. |
| D3.3 | Islamic finance regulation dummy | Higher better | IFSB | 2022 | 1 if a dedicated legal/regulatory framework exists, else 0. |
| D3.4 | Muslim population share (0–1) | Higher better | Pew Research Center | 2022 | Latent-demand proxy; limited discriminatory power in this sample (Section 3.4). |
| D4.1 | Renewables in energy consumption (0–1) | Higher better | International Energy Agency | 2022 | Used in share form. |
| D4.2 | Renewable electricity generation per capita (kWh) | Higher better | Our World in Data | 2022 | — |
| D4.3 | Carbon intensity of GDP (kg CO₂e per 2021 PPP$) | Lower better (inverted) | World Bank, EN.GHG.CO2.RT.GDP.PP.KD | 2022 | Harmonised single-unit series used for all five countries; this World Bank measure was adopted to ensure a consistent unit definition across the sample. |
| D4.4 | Net-zero / long-term strategy dummy | Higher better | Net Zero Tracker | 2022 | 1 if a net-zero/long-term strategy exists, else 0. |
| D5.1 | External debt stocks (% of GNI) | Lower better (inverted) | World Bank, WDI | 2022 | Used in ratio form. |
| D5.2 | Current account balance (% of GDP) | Higher better | World Bank, WDI | 2022 | Negative values retained as recorded. |
| D5.3 | Total reserves in months of imports | Higher better | World Bank, WDI | 2022 | Ratio-based adequacy measure; the dollar level of reserves is used only in the levels robustness variant (Table A5). The level of GDP is deliberately excluded from this dimension (see Section 3.6). |
Table A2 (Appendix 2). Robustness of the Ordering under Alternative Weights and Z-Score Aggregation Show tableHide table
| Country | TS-SFI | Rank | Alt-weight | Rank | z-score | Rank |
|---|---|---|---|---|---|---|
| Türkiye | 0.649 | 1 | 0.651 | 1 | +0.684 | 1 |
| Uzbekistan | 0.503 | 2 | 0.544 | 2 | +0.156 | 2 |
| Azerbaijan | 0.342 | 3 | 0.264 | 5 | −0.173 | 4 |
| Kazakhstan | 0.322 | 4 | 0.282 | 4 | −0.171 | 3 |
| Kyrgyzstan | 0.283 | 5 | 0.339 | 3 | −0.496 | 5 |
Table A3 (Appendix 2). Leave-One-Dimension-Out Sensitivity (Composite Score; Rank in Parentheses) Show tableHide table
| Country | Excl. D1 | Excl. D2 | Excl. D3 | Excl. D4 | Excl. D5 |
|---|---|---|---|---|---|
| Türkiye | 0.693 (1) | 0.674 (1) | 0.561 (2) | 0.602 (1) | 0.715 (1) |
| Uzbekistan | 0.378 (4) | 0.534 (2) | 0.571 (1) | 0.565 (2) | 0.466 (2) |
| Azerbaijan | 0.428 (2) | 0.294 (3) | 0.373 (4) | 0.374 (3) | 0.243 (5) |
| Kazakhstan | 0.390 (3) | 0.171 (5) | 0.401 (3) | 0.313 (4) | 0.333 (4) |
| Kyrgyzstan | 0.354 (5) | 0.278 (4) | 0.305 (5) | 0.128 (5) | 0.350 (3) |
Table A4 (Appendix 2). Dimension Diagnostics: Association with the Composite and Variance Share Show tableHide table
| Dimension | Corr. with TS-SFI | Variance share |
|---|---|---|
| D1 Green finance capacity | 0.697 | 0.397 |
| D2 Institutional and regulatory framework | −0.108 | −0.034 |
| D3 Islamic finance potential | 0.864 | 0.436 |
| D4 Energy-transition readiness | 0.189 | 0.081 |
| D5 External finance and macro-financial buffers | 0.312 | 0.119 |
Table A5 (Appendix 2). Design-Variant Sensitivity: Institutional Source, Absolute Levels, and Per-Capita Scaling Show tableHide table
| Country | Headline | Rank | V-Dem D2 | Rank | Levels | Rank | Per capita | Rank |
|---|---|---|---|---|---|---|---|---|
| Türkiye | 0.649 | 1 | 0.587 | 1 | 0.815 | 1 | 0.755 | 1 |
| Uzbekistan | 0.503 | 2 | 0.496 | 2 | 0.293 | 4 | 0.398 | 2 |
| Azerbaijan | 0.342 | 3 | 0.235 | 5 | 0.332 | 2 | 0.342 | 3 |
| Kazakhstan | 0.322 | 4 | 0.268 | 4 | 0.320 | 3 | 0.332 | 4 |
| Kyrgyzstan | 0.283 | 5 | 0.422 | 3 | 0.280 | 5 | 0.280 | 5 |
Table A6 (Appendix 2). Data-Driven Weighting and Indicator-Exclusion Variants Show tableHide table
| Country | Entropy (dimension level) | Rank | Entropy (indicator level) | Rank | D3 excl. Muslim share | Rank |
|---|---|---|---|---|---|---|
| Türkiye | 0.637 | 2 | 0.764 | 1 | 0.649 | 1 |
| Uzbekistan | 0.654 | 1 | 0.262 | 2 | 0.457 | 2 |
| Azerbaijan | 0.204 | 3 | 0.210 | 4 | 0.299 | 4 |
| Kazakhstan | 0.131 | 5 | 0.189 | 5 | 0.322 | 3 |
| Kyrgyzstan | 0.147 | 4 | 0.248 | 3 | 0.248 | 5 |
Table A7 (Appendix 3). TS-SFI and Existing Sustainable Finance Measurement Frameworks Show tableHide table
| Framework | Geographical scope | Dimensional focus | Indicator basis | Intended use |
|---|---|---|---|---|
| Climate-related Financial Policy Index (D’Orazio and Thole) | Global, country level | Engagement in green financial policymaking | Adopted policies and instruments | Cross-country policy comparison |
| EY Sustainable Finance Index (Lofts and Meekings) | Global, country level | ESG-oriented sustainable finance progress | Aggregated cross-country indicators | Market benchmarking and gap analysis |
| GFLAC Sustainable Finance Index | Latin America and the Caribbean | Climate-relevant public finance and fiscal structure | National budget and finance data | Civil-society monitoring and advocacy |
| DJSI and ESG index families (Schmutz et al.; Tehrani et al.) | Global, firm level | Corporate sustainability performance | Firm-level ESG assessments | Investment screening and benchmarks |
| TS-SFI (this study) | Five OTS member states | Readiness profile: scale-adjusted green finance market depth, governance, Islamic finance potential, energy-transition context, macro-financial buffers | Country-level ratios from international databases | Regional diagnostic, monitoring, and coordination tool for the Turkic Green Vision |
References
- Abazov, Rafis, Aziza Zhuparova, Alexandra Molchanovskaya, and Bakhytgul Yeleussizova. Kazakhstan: Challenges and Strategies towards Green Transformation and Sustainable Development. UNCTAD, Integrated Policy Strategies and Regional Policy Coordination for Resilient, Green and Transformative Development, Project Paper No. 21, 2025, unctad.org/system/files/information-document/unda2030d21-kazakhstan-green-transformation_en.pdf. Accessed 20 Nov. 2025.
- Altıntaş, Furkan Fahri. “Avrupa Birliği Ülkelerin Sürdürülebilir Kalkınma Performanslarının MEREC Tabanlı WEDBA Yöntemi ile Analizi.” Ordu Üniversitesi Sosyal Bilimler Enstitüsü Sosyal Bilimler Araştırmaları Dergisi, vol. 14, no. 1, 2024, pp. 117–137. https://doi.org/10.48146/odusobiad.1253850.
- Aneja, Ranjan, Shine Raju Kappil, Narasingha Das, and Umer Jeelanie Banday. “Does the Green Finance Initiatives Transform the World into a Green Economy? A Study of Green Bond Issuing Countries.” Environmental Science and Pollution Research, vol. 30, no. 14, 2023, pp. 42214–42222. https://doi.org/10.1007/s11356-023-25317-w.
- Ani, Salis Musta, and Hotman Fredy. “Mekanisme Governance dan Pengungkapan Sustainable Finance: Untuk Melihat Tingkat Kesiapan Penerapan Sustainable Finance pada Perusahaan Jasa Keuangan Terdaftar di BEI.” Jurnal Akuntansi, vol. 21, no. 3, 2017, pp. 437–447. https://doi.org/10.24912/ja.v21i3.247.
- Astana International Financial Centre. Green Finance Market in Kazakhstan. Astana International Financial Centre, 2023, aifc.kz/wp-content/uploads/2024/07/3.3-green-finance-market-of-kazakhstan.pdf. Accessed 20 Nov. 2025.
- Astana International Financial Centre. State of Sustainable Finance in Central Asia. Astana International Financial Centre and Green Investment Principles, 2024, aifc.kz/wp-content/uploads/2024/07/1.3-ca-to-publish-eng_compressed.pdf. Accessed 20 Nov. 2025.
- Ateş, Sinem, and Özlem Usman. “Gelişmekte Olan Ülkelerin Sürdürülebilir Kalkınma Performanslarının Gri İlişkisel Analiz Yöntemiyle Değerlendirilmesi.” İktisadi İdari ve Siyasal Araştırmalar Dergisi, vol. 6, no. 15, 2021, pp. 225–248. https://doi.org/10.25204/iktisad.901030.
- Aytekin, Ahmet, and Hakan Gökhan Gündoğdu. “OECD ve AB Üyesi Ülkelerin Sürdürülebilir Yönetişim Düzeylerine Göre SWARA Tabanlı TOPSIS-SORT-B ve WASPAS Yöntemleriyle İncelenmesi.” Marmara Üniversitesi Öneri Dergisi, vol. 16, no. 56, 2021, pp. 943–971. https://doi.org/10.14783/maruoneri.862996.
- Cantero-Saiz, María, Salvatore Polizzi, and Enzo Scannella. “ESG and Asset Quality in the Banking Industry: The Moderating Role of Financial Performance.” Research in International Business and Finance, vol. 69, 2024, 102221. https://doi.org/10.1016/j.ribaf.2024.102221.
- Çallıoğlu, Layla. Green Energy Cooperation among Turkic States: Perspectives and Challenges. CESD Press, 2024, www.cesd.az. Accessed 20 Nov. 2025.
- D’Orazio, Paola, and Steffen Thole. “Climate-related Financial Policy Index: A Composite Index to Compare the Engagement in Green Financial Policymaking at the Global Level.” Ecological Indicators, vol. 141, 2022, 109065. https://doi.org/10.1016/j.ecolind.2022.109065.
- Fatemi, Ali M., and Iraj J. Fooladi. “Sustainable Finance: A New Paradigm.” Global Finance Journal, vol. 24, no. 2, 2013, pp. 101–113. https://doi.org/10.1016/j.gfj.2013.07.006
- Filipović, Sanja, Andrei Orlov, and Andrea Andrejević Panić. “Key Forecasts and Prospects for Green Transition in the Region of Central Asia Beyond 2022.” Energy, Sustainability and Society, vol. 14, no. 1, 2024, 25. https://doi.org/10.1186/s13705-024-00457-0
- Forbes Kazakhstan. “Исламский банк «ADCB» [ADCB Islamic Bank, formerly Al Hilal].” Рейтинг банков Казахстана [Ranking of Kazakhstan’s Banks], Forbes Kazakhstan, forbes.kz/ranking/object/34. Accessed 21 Sept. 2026.
- Forbes Kazakhstan. “Исламский банк «Заман-Банк» [Islamic Bank Zaman-Bank].” Рейтинг банков Казахстана [Ranking of Kazakhstan’s Banks], Forbes Kazakhstan, forbes.kz/ranking/object/39. Accessed 21 Sept. 2026.
- Fuest, Clemens, and Volker Meier. “Sustainable Finance and Climate Change: Wasteful but a Political Commitment Device?” Journal of Environmental Economics and Management, vol. 118, 2023, 102795. https://doi.org/10.1016/j.jeem.2023.102795
- Gao, Jiazhan, Guihong Hua, and Baofeng Huo. “Source Reduction and Innovation: Can Sustainable Finance Assist in Mitigating Haze Pollution?” Journal of Cleaner Production, vol. 449, 2024, 141772. https://doi.org/10.1016/j.jclepro.2024.141772
- GFLAC. Sustainable Finance Index 2021. Green Finance for Latin America and the Caribbean, 2021, sustainablefinance4future.org. Accessed 20 Nov. 2025.
- International Energy Agency. World Energy Balances. International Energy Agency, 2023, iea.org/data-and-statistics. Accessed 20 Nov. 2025.
- International Monetary Fund. Climate Change Indicators Dashboard: Green, Social, Sustainability and Sustainability-Linked Bond Issuance by Country. International Monetary Fund, 2024, climatedata.imf.org. Accessed 2 July 2026.
- Iqbal, Muhammad Ahsan, Wasim Abbas Shaheen, Suheela Shabir, Usman Ullah, Ionel-Alin Ienciu, Marius-Ioan Mihut, António Raposo, and Heesup Han. “Towards a Green Economy: Investigating the Impact of Sustainable Finance, Green Technologies, and Environmental Policies on Environmental Degradation.” Journal of Environmental Management, vol. 374, 2025, 124047. https://doi.org/10.1016/j.jenvman.2025.124047
- Islamic Corporation for the Development of the Private Sector, and LSEG. Islamic Finance Development Report 2023: Navigating Uncertainty. ICD and LSEG, 2023, icd-ps.org/uploads/files/ICD_LSEG_IFDI_REPORT_20231715587527_9247.pdf. Accessed 20 Nov. 2025.
- Islamic Financial Services Board. Islamic Financial Services Industry Stability Report 2023. Islamic Financial Services Board, 2023, www.ifsb.org/wp-content/uploads/2023/10/Islamic-Financial-Services-Industry-Stability-Report-2023_En.pdf. Accessed 20 Nov. 2025.
- Islamic Financial Services Board. Prudential and Structural Islamic Financial Indicators (PSIFIs) Database. Islamic Financial Services Board, 2025, data.ifsb.org. Accessed 20 Nov. 2025.
- Jiang, Lili, Hui Wang, Aihua Tong, Zhifei Hu, Hongjun Duan, Xiaolei Zhang, and Yifeng Wang. “The Measurement of Green Finance Development Index and Its Poverty Reduction Effect: Dynamic Panel Analysis Based on Improved Entropy Method.” Discrete Dynamics in Nature and Society, vol. 2020, 2020, 8851684. https://doi.org/10.1155/2020/8851684
- Liu, Xing, Minghui Lan, Xiaonan Wang, Yongji Zhang, and Zhi Su. “The Impact of Sustainable Finance Development on Energy Efficiency in Emerging Economies.” Frontiers in Environmental Science, vol. 11, 2023, 1273784. https://doi.org/10.3389/fenvs.2023.1273784
- Lofts, Gill, and Karl Meekings. EY Sustainable Finance Index 2022: How to Put ESG Back on Track. Ernst and Young, 2022, ey.com. Accessed 20 Nov. 2025.
- Lydenberg, Steve, and Alexi White. “Responsible Investment Indexes: Origins, Nature and Purpose.” The Routledge Handbook of Responsible Investment, edited by Tessa Hebb, James P. Hawley, Andreas G. F. Hoepner, Agnes L. Neher, and David Wood, Routledge, 2015, pp. 527–535. https://doi.org/10.4324/9780203104415
- Miralles-Quirós, María Mar, and José Luis Miralles-Quirós. “Sustainable Finance and the 2030 Agenda: Investing to Transform the World.” Sustainability, vol. 13, no. 19, 2021, 10505. https://doi.org/10.3390/su131910505
- Muyinza, Yekonia. Sustainable Banking: Embedding ESG in Financial Institutions’ Investment Decisions. Uganda Bankers Association, 2024, ugandabankers.org/wp-content/uploads/2024/12/Sustainable-Banking-Embedding-ESG-in-Investment-Decisions-UBA-WP.pdf. Accessed 20 Nov. 2025.
- Nawaz, Ali, Zhengzheng Li, and Chi Wei Su. “Inquisitive Exploration of Green Finance, Social Finance, and Capital Formation in Shaping Economic Development: Insights from BRICS Countries.” Discover Sustainability, vol. 5, no. 1, 2024, 332. https://doi.org/10.1007/s43621-024-00548-0
- Net Zero Tracker. Net Zero Tracker. Energy and Climate Intelligence Unit, Data-Driven EnviroLab, NewClimate Institute, and Oxford Net Zero, 2023, zerotracker.net. Accessed 20 Nov. 2025.
- OECD. Financing Uzbekistan’s Green Transition: Capital Market Development and Opportunities for Green Bond Issuance. OECD Publishing, 2023. https://doi.org/10.1787/27d2489d-en. Accessed 20 Nov. 2025.
- Onyimadu, Chukwuemeka Onyebuchi, and Daniel Sunday Uche. “Evaluating the Nigerian Government’s Financial Obligations to Climate Change Adaptation Strategies.” Climate Services, vol. 24, 2021, 100261. https://doi.org/10.1016/j.cliser.2021.100261
- Organization of Turkic States. Turkic Green Vision: Unity for a Sustainable Future Declaration. Organization of Turkic States, 2024, turkicstates.org. Accessed 20 Nov. 2025.
- Our World in Data. Energy, Electricity and Governance Data. Global Change Data Lab, 2024, ourworldindata.org. Accessed 2 July 2026.
- Participation Banks Association of Türkiye. Participation Banks 2022. TKBB, 2023, en.tkbb.org.tr. Accessed 2 July 2026.
- Pew Research Center. The Future of World Religions: Population Growth Projections, 2010–2050. Pew Research Center, 2015, www.pewresearch.org/religion/2015/04/02/religious-projections-2010-2050/. Accessed 20 Nov. 2025.
- PwC. ESG Awareness Survey — Azerbaijan. PricewaterhouseCoopers, 2024, www.pwc.com/kz/en/assets/esg-awareness/az-esg-awareness.pdf. Accessed 20 Nov. 2025.
- Qudriyah, Haqqi Lailatul, Hastuti, Dian Imanina Burhany, and Sumiyati Sumardi. “An Analysis of Sustainable Finance Disclosure at Indonesian Sharia Commercial Banks Using POJK 51/POJK.03/2017: Its Determinants and Influence on the Profitability.” Proceedings of the 2nd International Seminar of Science and Applied Technology (ISSAT 2021), Atlantis Press, 2021, pp. 544–551. https://doi.org/10.2991/aer.k.211106.085
- Rumansyah, A. Muh. Alif, and Yunieta Anny Nainggolan. “The Influenced of ESG Environmental Performance on Financial Performance: A Study of Indonesian Publicly Listed Companies.” Journal of Accounting and Finance Management, vol. 5, no. 6, 2025, pp. 1894–1903. https://doi.org/10.38035/jafm.v5i6.1565
- Schmutz, Bryan, Minoo Tehrani, Lawrence Fulton, and Andreas W. Rathgeber. “Dow Jones Sustainability Indices, Do They Make a Difference? The U.S. and the European Union Companies.” Sustainability, vol. 12, no. 17, 2020, 6785. https://doi.org/10.3390/su12176785
- Sunarya, Silma Lafifa, and Aam Slamet Rusydiana. “A Qualitative Review on Islamic Sustainable Finance.” Al-Muzara’ah, vol. 10, no. 2, 2022, pp. 197–212. https://doi.org/10.29244/jam.10.2.197-212
- Tehrani, Minoo, Andreas Rathgeber, Edward Dougherty, Lawrence Fulton, and James Fournier. “Dow Jones Sustainability Indices and ESG Scores: Do They Tell the Same Story?” Sustainability, vol. 16, no. 14, 2024, 6110. https://doi.org/10.3390/su16146110
- Thompson, Simon. Green and Sustainable Finance: Principles and Practice in Banking, Investment and Insurance. 2nd ed., Kogan Page, 2023.
- Tischer, Daniel, and Tomaso Ferrando. “Shaping the Climate Transition: Multistakeholder Networks, Elites, and Sustainable Finance Policy in Europe.” Finance and Society, vol. 10, no. 2, 2024, pp. 113–136. https://doi.org/10.2218/fas.2023.9
- UNDP. An Assessment of the Green Finance Market in the Kyrgyz Republic. United Nations Development Programme, 2023, www.undp.org/kyrgyzstan/publications/green-finance-market-assessment-kyrgyzstan. Accessed 20 Nov. 2025.
- Wang, Peijia, and Xuelu Xu. “Green Finance and Energy Efficiency Improvement: The Role of Green Innovation and Industrial Upgrading.” Innovation and Green Development, vol. 4, no. 1, 2025, 100200. https://doi.org/10.1016/j.igd.2024.100200
- World Bank. World Development Indicators. World Bank, 2024, databank.worldbank.org/source/world-development-indicators. Accessed 2 July 2026.
- World Bank. Worldwide Governance Indicators. World Bank, 2024, databank.worldbank.org/source/worldwide-governance-indicators. Accessed 2 July 2026.